
Figure 7. Validation of the subset of wildtype NOTCH1 HNSCC tumors with increased HES1/HEY1 expression in TCGA HNSCC cohort of 279 tumor tissues and 37 adjacent normal tissues.
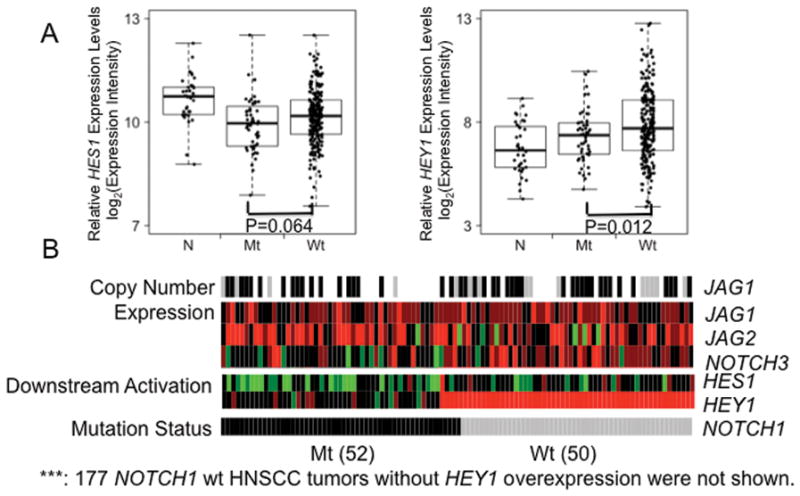
A. Comparison of HES1/HEY1 expression among adjacent normal mucosa, NOTCH1 mutant and wild type HNSCC tumors. NOTCH1 mutant HNSCC tumors have decreased HES1/HEY1 expression in comparison to those in NOTCH1 wildtype HNSCC tumors. N, adjacent normal mucosa, Mt, NOTCH1 mutant HNSCC tumors, Wt, NOTCH1 wild type HNSCC tumors. Boxes represent the interquartile range (25th–75th percentile) and horizontal lines inside the boxes indicate median. Whiskers indicate the minimum and maximum values. P value was calculated by using t test. B. Heat-map display of copy number alteration (JAG1), transcriptional alteration (JAG1, JAG2 and NOTCH3) and downstream activations (HES1 and HEY1) of NOTCH pathway in 52 NOTCH1 mutant and 50 NOTCH1 wild type HNSCC tumors (with HEY1 overexpression) from the TCGA HNSCC cohort. Gray denotes HNSCC tumor with wild type NOTCH1, black, HNSCC tumor with mutant type NOTCH1. Red and green indicate over- or under-expression, respectively.