
Figure 1.
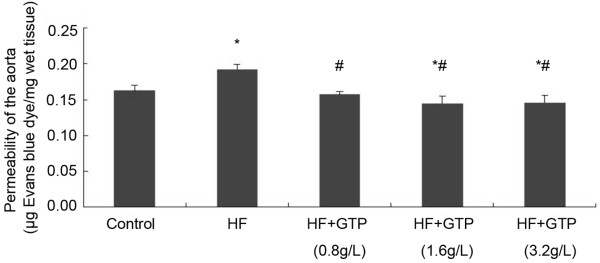
Effects of GTPs treatment on HF-induced hyperpermeability in rat aorta. Data are expressed as mean ± SEM (N = 6). * indicates P < 0.05 compared to the control and # indicates P < 0.05 compared to the HF group.
Official websites use .gov
A
.gov website belongs to an official
government organization in the United States.
Secure .gov websites use HTTPS
A lock (
) or https:// means you've safely
connected to the .gov website. Share sensitive
information only on official, secure websites.
Effects of GTPs treatment on HF-induced hyperpermeability in rat aorta. Data are expressed as mean ± SEM (N = 6). * indicates P < 0.05 compared to the control and # indicates P < 0.05 compared to the HF group.