
Figure 3.
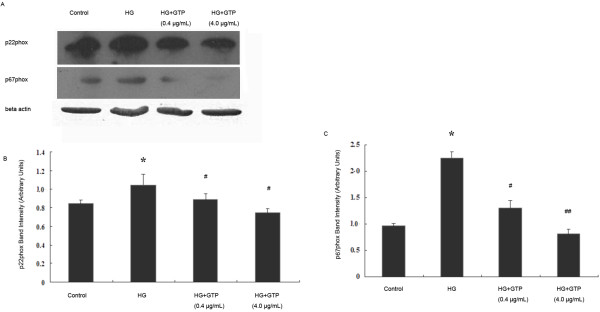
Effects of GTPs treatment on expressions of NADPH oxidase subunits p22phox and p67phox in BAECs. Protein levels were determined by Western blotting, and a representative study is shown (A). The bar graph represents three combined experiments. The results of the densitometric analysis (mean ± SEM, N = 3) of immunoblots of NADPH oxidase subunit p22phox(B), p67phox(C). * indicates P < 0.05 compared to the control, # indicates P < 0.05 compared to the HG group, and ## indicates P < 0.01 compared to the HG group.