
Figure 2.
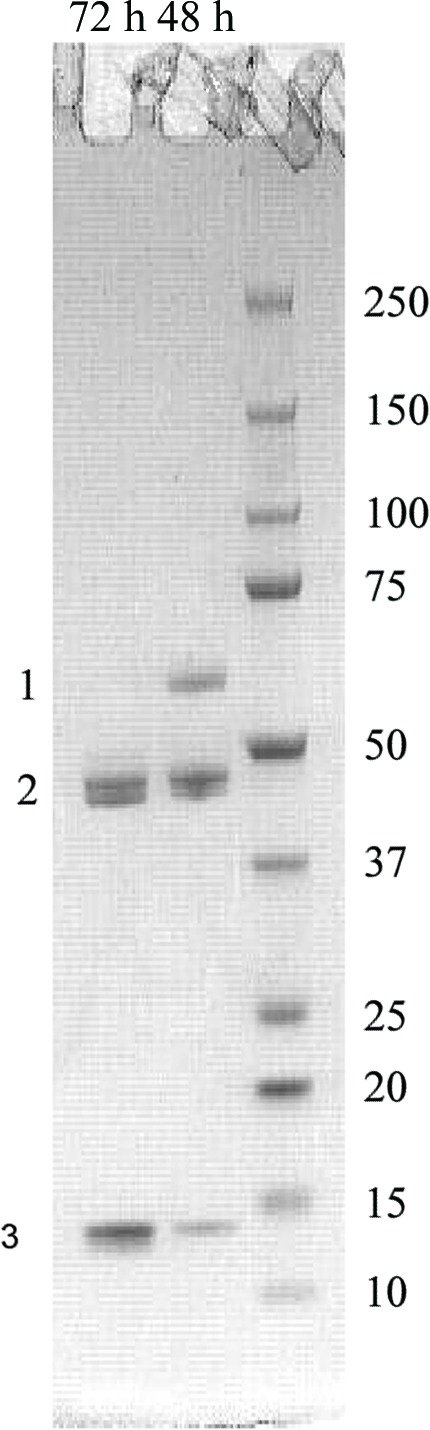
Fragmentation patterns from AtzF trypsinolysis. Tryptic digestion of AtzF resulted in the fragmentation of AtzF into two distinct bands on SDS–PAGE. The lane next to the ladder (right lane; labelled in kDa) shows a partial digest of AtzF 48 h after adding trypsin. The highest molecular weight band (labelled 1) represents undigested AtzF. The two bands adjacent to each other at nearly 48 kDa (labelled 2) possessed the same peptide sequence (as determined by N-terminal sequencing) and contain the N-terminus. The smallest visible band (labelled 3) is the 14 kDa C-terminal fragment of AtzF.