
Figure 3.
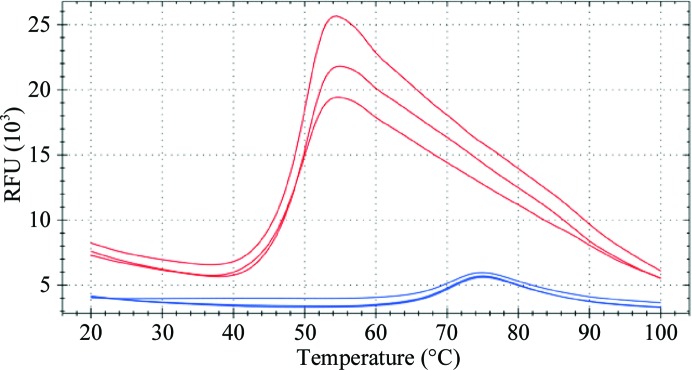
Melting curve. A temperature melting curve of AtzF was performed in triplicate, using differential scanning fluorimetry with the dye SYPRO Orange. The red curves are the AtzF protein (in triplicate) in the buffer used for crystallization (50 mM HEPES, 100 mM NaCl pH 7.5). The blue curves are a 0.1 mg ml−1 lysozyme control.