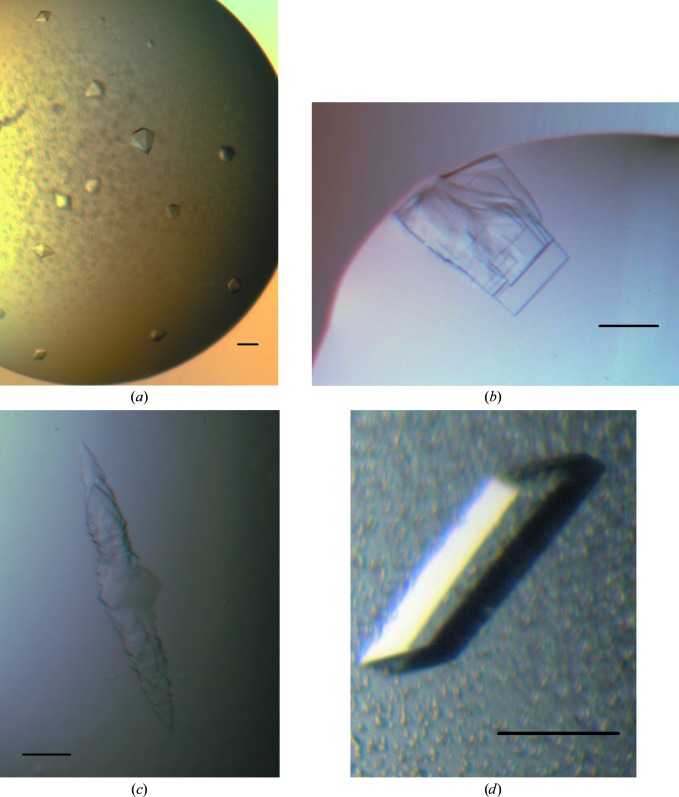
Figure 4.
AtzF crystals. The scale bar represents 100 µm in each case. (a) Bipyramidal crystals of AtzF produced in 4 M sodium formate. These crystals diffracted X-rays to about 6.5 Å resolution and could not be reproduced. (b) Intergrown plates of trypsin-treated AtzF (in situ proteolysis) grown from 1 M ammonium sulfate, 1 M lithium sulfate, 0.1 M Tris chloride pH 8.5. (c) Intergrown plates of AtzF467 grown from 20%(w/v) PEG 6000, 0.1 M Na MES pH 6.5, 0.2 M calcium chloride. (d) Truncated AtzF crystals grown from 11%(w/v) PEG 3350, 2% Tacsimate pH 5 microseeded with the crystals shown in (c). These crystals diffracted X-rays to 2.5 Å resolution and were used for data collection.

