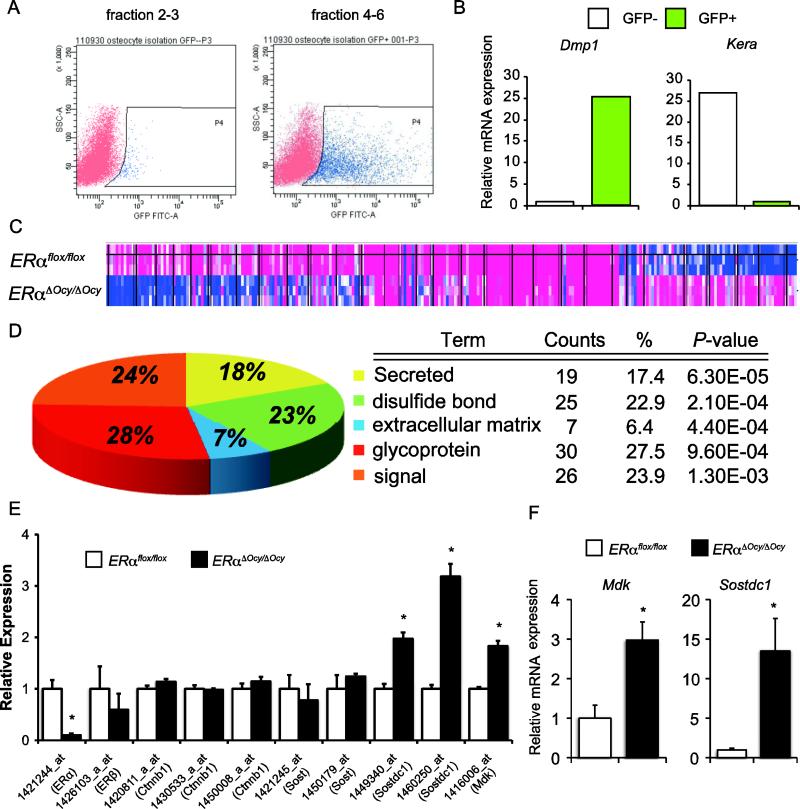
Fig. 4. Osteocytes lacking ERα show increased Mdk and Sostdc1 expression.
(A) Two-dimensional dot plot of cells obtained from sequential enzymatic digestion of calvariae of mice expressing Dmp1-GFP. Left: fraction 2-3, Right: fraction 4-6. (B) Expression of osteocyte (Dmp1) and osteoblast (Kera) marker genes in the GFP− and GFP+ population of isolated cells. (C) Heat map of significantly regulated genes in the gene expression microarray using total RNA from isolated GFP+ cells of ERαflox/flox and ERαΔOcy/ΔOcy mice harboring Dmp1-GFP (n=3). Red: high expression. Blue: low expression. (D) Functional annotation clustering of Keywords by DAVID Bioinformatic Resources. (E) Relative microarray intensity of each probe for ERα, ERβ, Ctnnb1 (β-catenin), Sost, Sostdc1 and Mdk. Data are represented as mean ± SEM (n=3). (F) RT-qPCR for Mdk and Sostdc1 as same as panel E. * indicates p<0.05.

