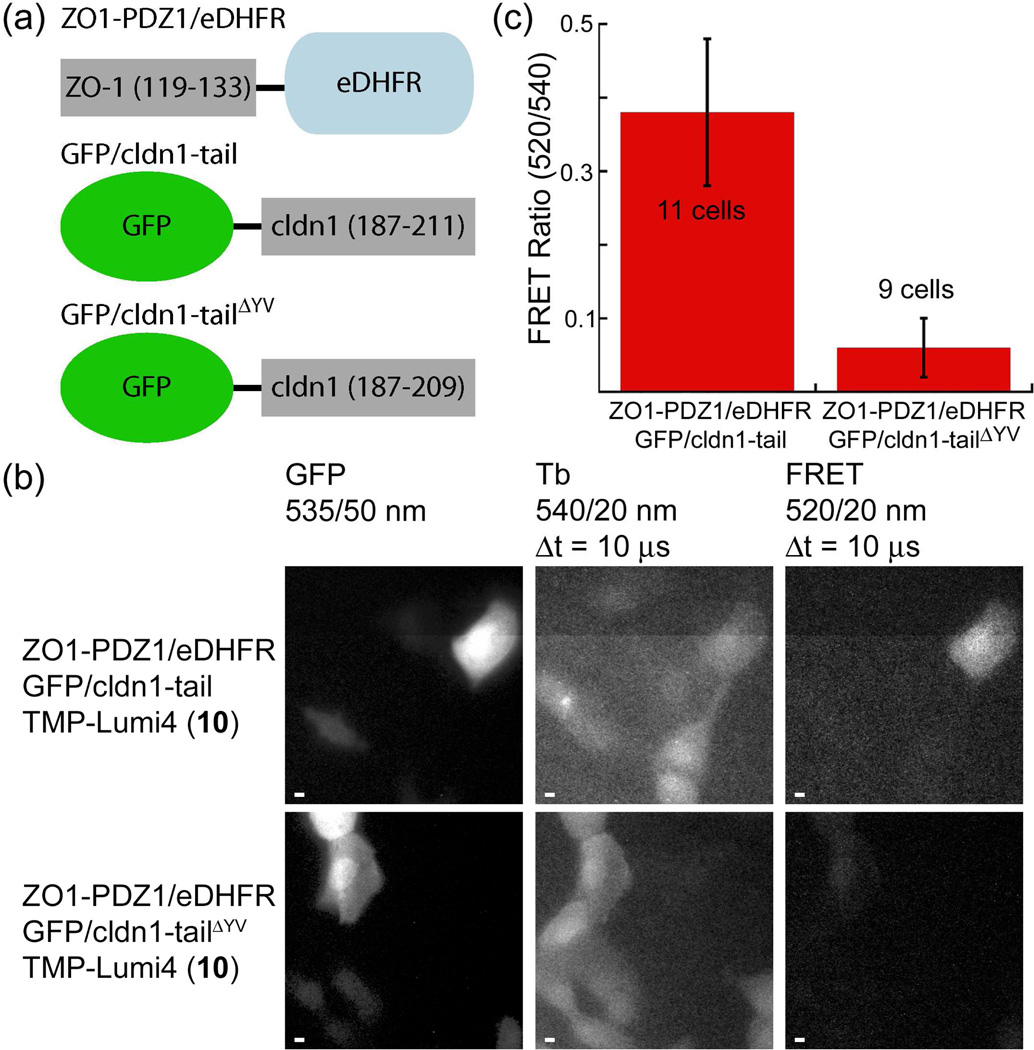
Figure 4. Time-gated FRET microscopy detects protein-protein interactions in live cells with high confidence in single-frame images.
(a) Schematic of fusion proteins. (b) MDCKII cells were loaded with a TMP-Lumi4(TbIII) heterodimer (10) by osmotic lysis of pinosomes. Cells co-expressing indicated fusion proteins exhibited steady-state, GFP fluorescence (left). Time-gated detection of Tb(III) luminescence (middle) revealed cells loaded with 10. Tb(III)-to-GFP FRET (right) is seen in cells co-expressing ZO1-PDZ1/eDHFR and GFP/cldn1-tail and loaded with 10. No FRET signal is visible in cells co-expressing non-interacting ZO1-PDZl/eDHFR and GFP/cldn1-tailΔYV and loaded with 10. Micrographs: GFP fluorescence, λex = 480/40 nm; time-gated luminescence, λex = 365 nm, Δt = delay between excitation and detection. Emission at indicated wavelengths. Scale bars, 5 μm. (c) A significant (P < 10−6), >500% difference in the mean, donor-normalized FRET emission ratio (520/540 nm) was observed between cells expressing interacting and non-interacting fusion proteins. Mean ratios calculated from indicated sample size. Error bars, s.d. Data adapted from Rajapakse, et al.53

