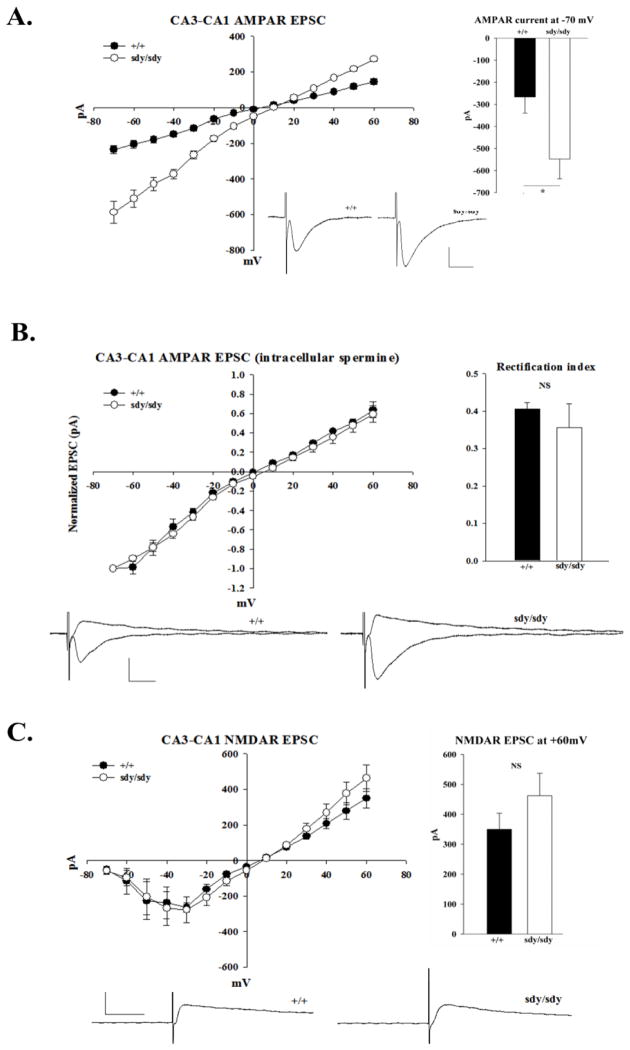
Figure 3. Enhanced CA3-CA1 AMPAR mediated transmission in sdy/sdy mice.
A. Peak currents of evoked whole cell CA3-CA1 AMPAR EPSCs from P14–17 +/+ (n = 7 cells) and sdy/sdy mice (n = 7 cells) was plotted as a function of voltage. 10 μM bicuculline and 50 μM D-APV were present in the bath solution during recordings. The bar graph displays the values of the average peak current obtained at Vh: −70mV. B. Current voltage relations of AMPAR EPSCs were obtained from +/+ (n = 3 cells) and sdy/sdy (n = 4 cells) with 100 μM spermine in the patch pipette. EPSC amplitudes were normalized to the value obtained at Vh: −70mV for each respective genotype. The rectification index was calculated as the ratio of peak EPSC currents obtained at Vh: +40mV and Vh: −70mV. C. The peak current of whole cell CA3-CA1 NMDAR EPSCs from +/+ (n = 5 cells) and sdy/sdy (n = 5 cells) mice was plotted as a function of voltage. Recordings were done with 10 μM bicuculline and 10μM CNQX present in the bath solution. The bar graph displays the values of the average peak current obtained at Vh +60mV. Reported values represent mean ± SEM. Statistical analysis was performed using the Mann-Whitney test. An asterisk denotes p<0.05 while NS denotes data were not significant.

