
Figure 3.
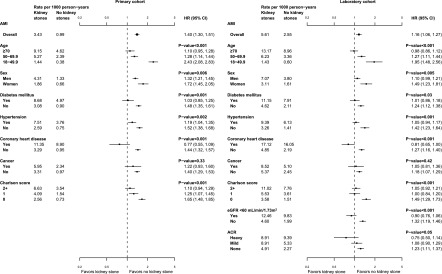
Forest plots of AMI events in the primary and laboratory cohorts, by strata. The plots show the relative adjusted hazards (with corresponding 95% confidence intervals) of AMI associated with the first kidney stone presentation during the study follow-up, overall (top square point symbol) and in subgroups. The left panel shows participants in the primary cohort (n=3,195,452); the right panel shows participants in the laboratory cohort (n=2,003,054). The P values are a measure of the interaction between each characteristic and the risk of AMI associated with the first kidney stone presentation. Hazard ratios from both cohorts were adjusted for age, sex, Aboriginal status, social assistance, residence location, and comorbid conditions (diabetes, hypertension, coronary heart disease, cancer, AIDS/HIV, cerebral vascular disease, chronic obstructive pulmonary disease, dementia, heart failure, mild liver disease, moderate/severe liver disease, paraplegia, peptic ulcer, peripheral vascular disease, and rheumatologic disease). Hazard ratios from the laboratory cohort have also been adjusted for baseline estimated GFR and albuminuria. ACR, albumin-to-creatinine ratio.