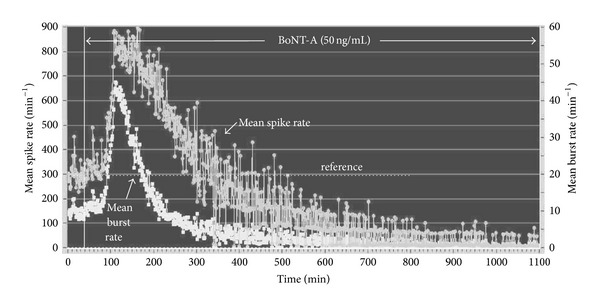
Figure 6.

Average spike (S) and burst (B) rate plot per minute of SC network activity exposed to 50 ng/mL BoNT-A at 138 minutes into the experiment (age: 30 d.i.v.; 34 discriminated units). A sharp increase in spike counts and bursts occurs after a delay of 62 min.
