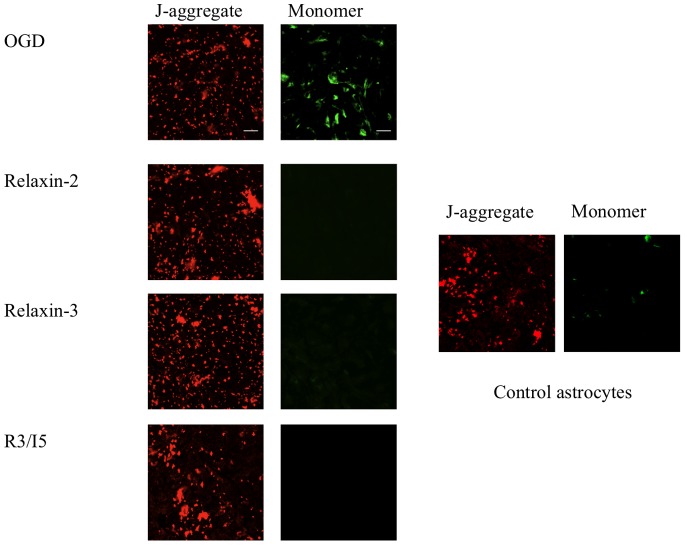
Figure 4. Mitochondrial membrane potential in response to 12 hours of oxygen- glucose deprivation.
Astrocytes were exposed to OGD for 12 hours and treated with serum-free, glucose-free media or relaxin-2 (10 and 50 ng/mL), relaxin-3 (10 and 50 ng/mL), and R3/I5 (10 and 50 ng/mL); Δψm as assessed with JC-1 (2 µg/mL). Decreases in Δψm are indicated by green fluorescence (monomer) compared with the J-aggregate (red fluorescence). Untreated astrocytes demonstrated an increase in monomer staining compared with relaxin-2, relaxin-3 and R3/I5. Control astrocytes indicate astrocytes that were not exposed to OGD and loaded with JC-1 as a control. Scale bar = 50 µm.

