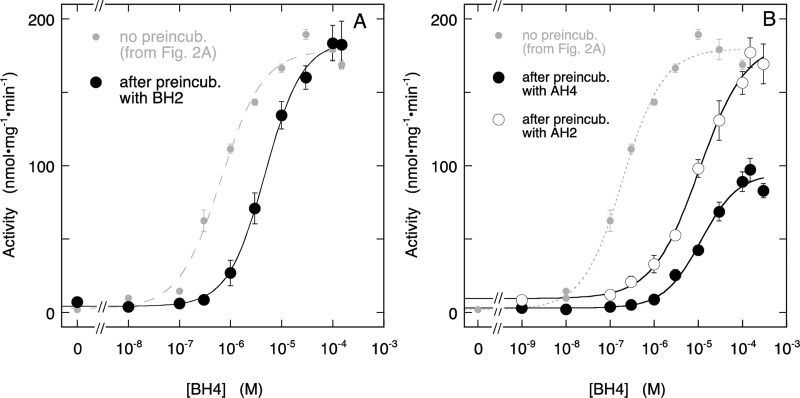
Figure 4.
Effect of BH4 on NO production by ECo-nNOS after overnight incubation with inhibitory pteridines. Panel A shows the stimulation by BH4 of NO formation, measured with the oxyHb assay, after overnight incubation with BH2. The curve through the data is the best fit to the Hill equation with fitting parameters EC50 = (4.7 ± 0.3) × 10–6 M, Act0 = 4 ± 2 nmol·mg–1·min–1, Act∞ = 185 ± 3 nmol·mg–1·min–1, h = 1.19 ± 0.08. For comparison, the curve obtained without overnight preincubation with BH2 (Figure 2A) is shown as well (gray small circles, dashed line). Panel B shows the stimulation by BH4 of NO formation, measured with the oxyHb assay, after overnight incubation with 4-amino-BH4 (closed circles) or 4-amino-BH2 (open circles). The curves through the data are best fits to the Hill equation with fitting parameters EC50 = (1.1 ± 0.3) × 10–5 M, Act0 = 3 ± 3 nmol·mg–1·min–1, Ac.∞ = 95 ± 6 nmol·mg–1·min–1, h = 1.0 ± 0.2 for 4-amino-BH4 preincubation and EC50 = (1.04 ± 0.19) × 10–5 M, Act0 = 9 ± 4 nmol·mg–1·min–1, Act∞ = 185 ± 8 nmol·mg–1·min–1, h = 0.82 ± 0.11 for 4-amino-BH2 preincubation. For comparison, the curve obtained without preincubation (Figure 2A) is included as well (small gray symbols, dashed line). Overnight incubation conditions: 5 μg/mL (∼27 nM) ECo-nNOS, 0.5 mM Arg, 0.5 mM CHAPS, 0.25 mM EDTA, and 25 μM pteridine (BH2, 4-amino-BH4, or 4-amino-BH2) in 50 mM TEA (pH 7.4) at ∼8 °C. Assay conditions: 2 μg/mL (∼11 nM) ECo-nNOS, 0.2 mM Arg, 0.2 mM NADPH, 5 μM FAD, 5 μM FMN, 10 μg/mL CaM, 0.5 mM CaCl2, 5 μM oxyHb, 1000 U/mL SOD, 50 mU/mL CAT, 0.2 mM CHAPS, 0.1 mM EDTA, 50 mM TEA (pH 7.4), and BH4 as indicated at 37 °C. Note that the assay samples also contain 10 μM BH2, (autoxidized) 4-amino-BH4, or 4-amino-BH2, carried over from the preincubation mixture. Data points are presented ± SEM (n = 4 or 3 for BH2 or 4-amino-BH4 preincubation, and for 4-amino-BH2 preincubation, respectively).

