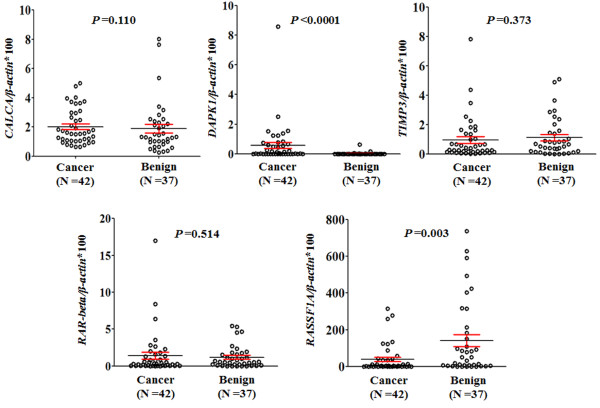
Figure 1.
The overall methylation levels of the five genes in FNAB DNA samples from the patients with thyroid nodules. Q-MSP assay was performed as described in Methods. The relative methylation level (on Y axis) is represented by ratios of candidate gene/β-actin (×100). Horizontal lines indicate a 95% confidence interval for the sample mean. P values <0.05 were considered significant.

