
Figure 1.
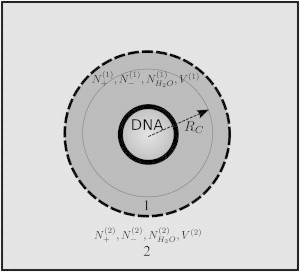
Ion counting using the two-domain approach (46), adapted from Anderson and Record (56). The simulated system is separated into two regions, dark gray (region 1) and light gray (region 2), with the boundary between the two regions shown as a dashed line. Region 1 has to be chosen so that it contains at least all the solvent and cosolvent within the correlation radius (see text) from the DNA, and region 2 so that it resembles the bulk with uniform concentration of salt. Using this approach, a formula for the PIPs can be derived that depends on the salt bulk (region 2) concentration. This method may be useful when the g(r) cannot be easily defined.