
Figure 2.
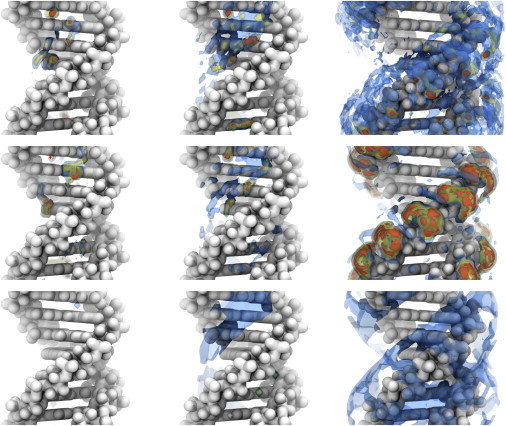
Cylindrical shells of sodium ion density around 24L DNA at 0.7452 M NaCl calculated by MD (upper row), 3D-RISM-PSE-4 (middle row), and NLPB (lower row). The shells isolate density extending radially from the DNA center of mass for 0–5 Å (left), 5–7.5 Å (center), and 7.5–15 Å (right) and correspond to regions identified in Figs. 3 and 5. Isosurfaces are at 4 (blue), 16 (yellow), and 64 times (orange) the bulk density. To see this figure in color, go online.