
Figure 4.
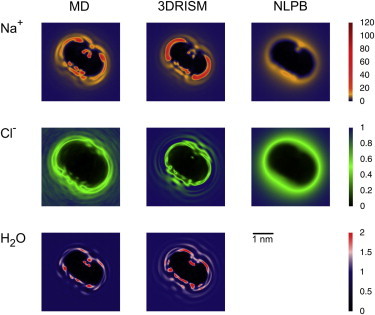
Untwisted ion and water normalized density distributions at 0.17 M NaCl. Results from MD with SPC/E (left), 3D-RISM-PSE-4 (middle), and NLPB (right) for sodium (upper row), chloride (middle row), and water oxygen (lower row). Due to the continuum treatment of the water dielectric effect, it is not possible to determine the distribution of water from NLPB theory in a straightforward manner.