
Figure 5.
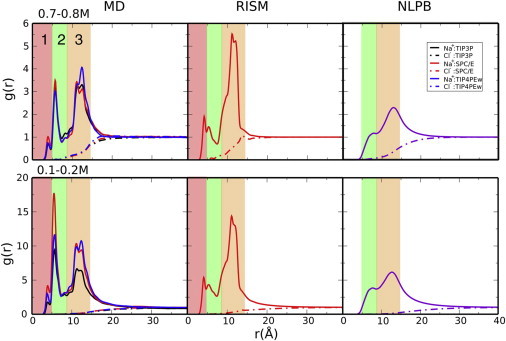
Na+ cylindrical RDFs obtained from explicit-solvent MD simulations (left), 3D-RISM (middle), and NLPB (right) at ∼0.2 M (upper) and ∼0.73 M (lower). A cylindrical subvolume ( and ) of the simulations was used to avoid end effects. Note that the normalization factor (salt bulk concentration) is slightly different (see Table S2) for each combination of water and ion models. To see this figure in color, go online.