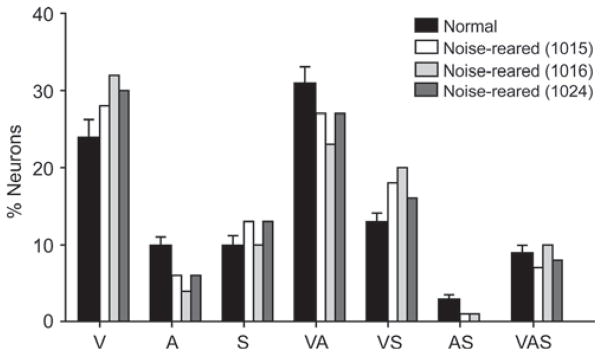
Fig. 1.

The modality-convergence patterns in the SC were similar in noise-reared and normally reared animals. The histogram shows the similar distributions of subtypes of unisensory and multisensory neurons in the SC of normally reared and noise-reared animals. Black bars (plus SEM represented by vertical lines) indicate the average distribution in normal animals, white and gray bars indicate the distribution in each of the noise-reared animals (1015; 1016; 1024). V, visual; A, auditory; S, somatosensory; VA, visual– auditory; VS, visual–somatosensory; AS, auditory–somatosensory; VAS, visual–auditory–somatosensory. The patterns were not significantly different in noise-reared and normally reared animals.
