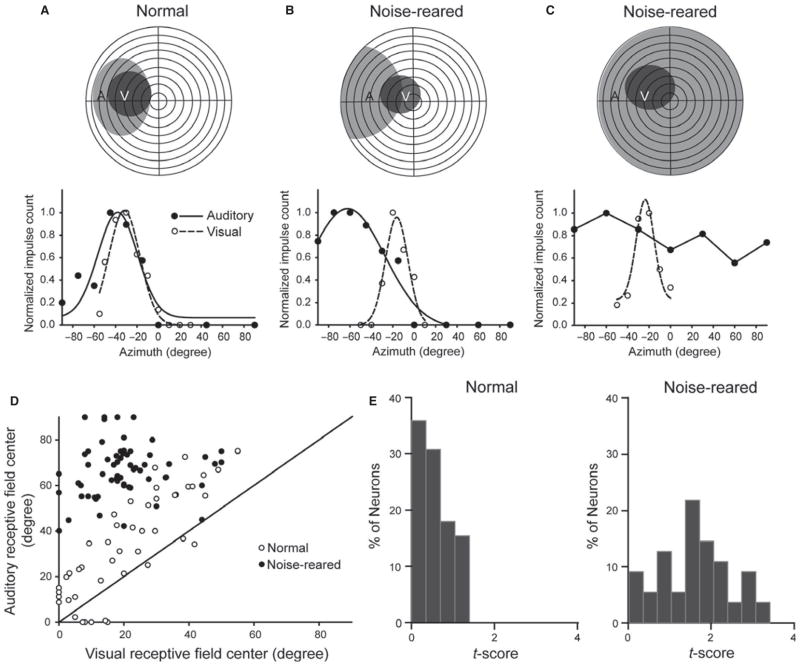
Fig. 4.
Auditory receptive fields and visual–auditory spatial register were abnormal in noise-reared animals. (A) An illustrative example of a visual–auditory neuron from a normal animal. At the top are shown the neuron’s visual (V) and auditory (A) receptive fields plotted on a schematic of visual–auditory space. In this flattened depiction of space, the horizontal and vertical lines depict meridians, and each concentric circle represents 10° of sensory space. The neuron’s response profile to a visual (dashed line) and auditory (solid line) stimulus at different azimuths is shown below. Responses were normalized to give the proportion of the maximum response at each location, ranging from 0 (locations yielding no impulses) to 1 (locations yielding the maximum number of impulses). Note the overlapping receptive fields and parallel visual–auditory spatial response profiles of this neuron. (B,C) Two neurons from a noise-reared animal. The example on the left (B) reflects the majority of the population, showing poor visual–auditory register and a lack of parallelism in the visual and auditory response profiles. The example on the right (C) illustrates a significant minority of neurons with very large (i.e. omnidirectional) and broadly tuned auditory receptive fields. (D) A plot of the auditory–visual center displacements in normal and noise-reared animals. The solid diagonal line represents the line of unity. There is little overlap among the normally reared and noise-reared populations due to the peripheral shift of nearly all the auditory receptive fields in noise-reared animals. (E) Histograms showing the rightward shift in receptive field alignment t scores (see text) in noise-reared animals relative to normal animals, reflecting lower spatial correspondence in their visual–auditory spatial tuning profiles.

