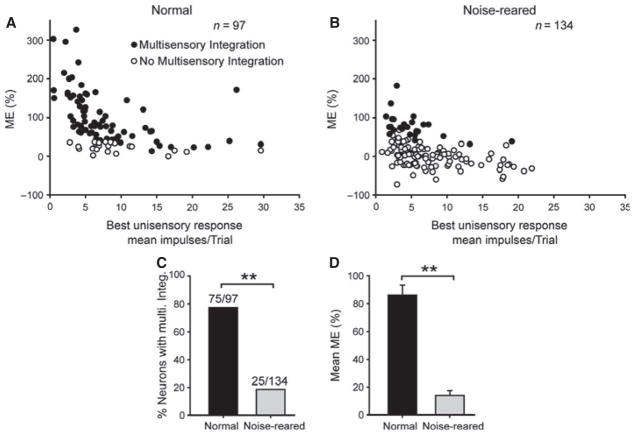
Fig. 6.
Multisensory integration was rare and yielded less response enhancement in noise-reared versus normally reared animals. (A,B) ME is plotted for each neuron as a function of the best (largest) unisensory response. Although the typically high proportion of neurons (n, number of neurons) in normally reared animals exhibited multisensory integration capabilities, few neurons in the noise-reared animals did. (C,D) These group differences are also evident in summary bar graphs which compare the incidences of multisensory integration, and the mean ME magnitudes (normally reared control, black bar; noise-reared, gray bar). These group differences characterized each of the animals studied. Conventions are the same as in previous figures.

