
Figure 6.
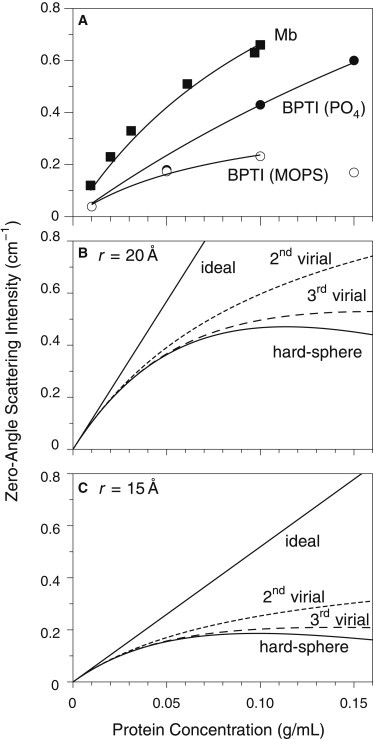
Analysis of zero-angle scattering intensities using the second-order virial representation. (A) The measured scattering intensities for Mb and BPTI were fit to Eq. 10, with the values of K fixed to those predicted by Eq. 3 and the molecular parameters specified in Materials and Methods. In each case, the curve indicates the range of concentrations used for the fit. The fit values for A2, the second virial coefficient, were 2.0 ×10⁻⁴, 1.6 ×10⁻⁴, and 9.2 ×10⁻⁴ cm3mol/g2 for Mb, BPTI in phosphate buffer and BPTI in MOPS, respectively. (B) Predicted dependence of I (0) for myoglobin, assuming ideal behavior, the analytic form of the hard-sphere structure factor (Eq. 7) or second- or third-order virial representations of S (0) (Eq. 9). In each case, a sphere radius of 20 Å was used, and K was assumed to have the value calculated from the molecular properties of Mb. (C) Predicted dependence of I (0) for BPTI, using the same representations as in panel B. For these calculations a sphere radius of 15 Å was used, and K was assumed to have the value calculated from the molecular properties of BPTI.