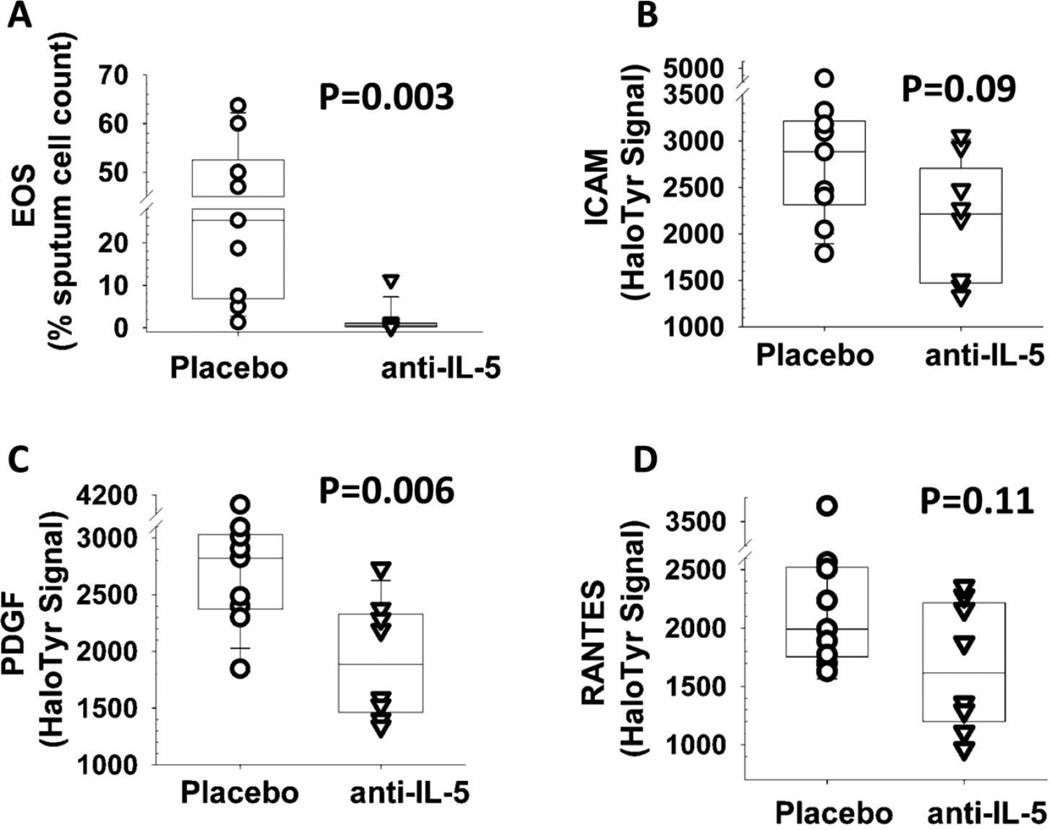
Figure 2.
Changes in eosinophils (EOS, panel A), and halotyrosine levels of intracellular adhesion molecule (ICAM, B), platelet-derived growth factor (PDGF, C), and RANTES (D) in sputum samples from asthmatics after treatment with placebo (n=9) or mepolizumab (anti-IL-5, n=8). Numbers above the columns indicate the p value, as determined by a Wilcoxon’s test. For each box plot, the embedded lateral line represents the median value, and the lower and upper limits of the boxes are the 25th and 75th quantiles, respectively.

