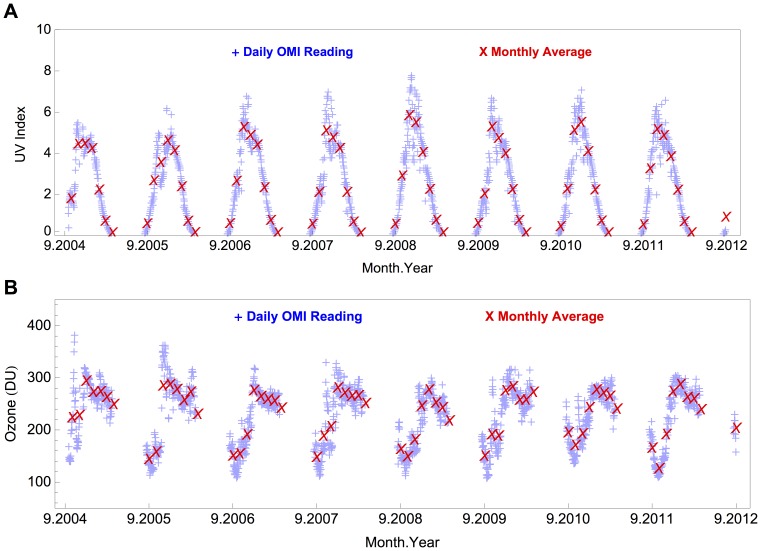
Figure 2. Time series of OMI-derived data at Union Glacier Camp.Figure 1. UV Irradiance at Union Glacier Camp.
The number “9” in the abscise tick labels means “September”. The blue crosses stand for the daily estimates; the red crosses stand for the monthly averages of the OMI-derived data. (a) Noontime UV index (UVI). (b) Total ozone column.

