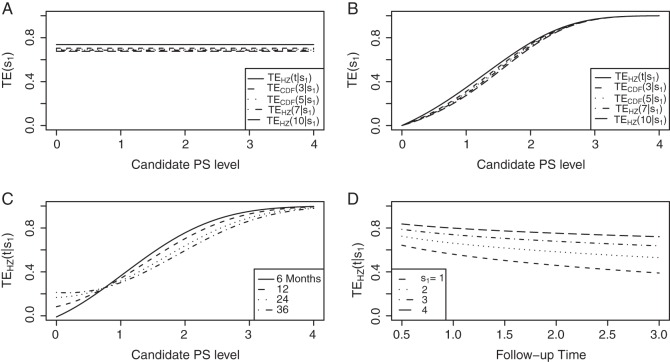
Figure 1.
(A) Displays the  curve which is constant over all time-points t and the
  curve for several time points for a useless surrogate in the time-independent hazard Weibull setting. (B) Displays the
  curve for a high-quality surrogate in the time-independent hazard setting and several
  curves for different time points t for this same surrogate scenario. (C) Displays
  curves for given amounts of follow-up time after
  and over the range of
  for a high-quality surrogate. These curves illustrate time variation in TE that is both associated with the candidate surrogate and exists when
  ; the figure depicts a candidate surrogate that declines in value over time while the average TE is remaining approximately the same over time. (D) Displays
  curves for given levels of
  over a range of follow-up times (
 ) in years for a medium-quality surrogate. These curves illustrate time variation in TE that is approximately equal over all levels of the candidate surrogate; the figure depicts a candidate surrogate that retains some value as a PS over time but for declining TE.

