Introduction
Discogenic back pain is a challenging clinical problem to both diagnose and treat. While the etiology is uncertain in most patients, it has sometimes been linked to deficits in tissue structure [1]. The healthy intervertebral disc consists of an outer annulus fibrosus that surrounds the inner nucleus pulposus. The annulus consists of concentric lamellar collagenous rings. The nucleus comprises a proteoglycan-rich matrix that osmotically swells to generate hydrostatic pressure that resists spinal compression. Disc degeneration includes changes in matrix composition leading to deterioration of tissue mechanical properties, such as nuclear depressurization, which can degrade overall spinal biomechanical behavior. Mechanical insufficiency, along with infiltration and sensitization of pain transmitting neurons (nociceptors), may be responsible for discogenic pain [2]. Thus, recent biologic therapies aim to stimulate matrix synthesis in attempt to re-establish mechanical properties [3].
Differences in mechanical properties of degenerated compared to normal intervertebral discs may therefore provide clues to help direct therapies for symptomatic disc degeneration. We know that degeneration decreases nuclear energy dissipation [4], swelling pressure, and compressive modulus relative to normal nucleus [5]. Additionally, the degenerated annulus has a higher compressive stiffness that correlates with tissue dehydration [6]. Consequently, degenerated discs have a breakdown in matrix function, resulting in compromised biomechanical behavior.
However, not all degenerated discs are painful, as many asymptomatic individuals have MRI evidence of disc degeneration [7,8]. This suggests subtle features may be related to pain that are not reliably quantified with standard diagnostic tests. Clinically, patients with back pain may present with disc degeneration and a painful motion segment. While the precise source of the pain is difficult to identify, the intervertebral disc may be contributory. Histologic data indicate that painful degenerated discs have disordered annulus lamellar structure, innervation, and vascular granulation tissue [1,9,10]. These qualitative observations have not been supported by quantitative analyses to assess their biomechancial significance. One overarching research goal is to quantify and understand these features that may be responsible for disc pain. However, the current study lacks the clinical diagnostics necessary to investigate the painful disc. Instead, this study focuses on degenerated discs from chronic back pain patients without deformity compared to a deformity control group. Using in vitro testing, we hypothesized that discs from non-deformity and deformity patients have differing mechanical and biochemical properties.
Materials and Methods
Patient and Group Selection
Patients in the study were placed into one of two groups: “non-deformity” and “deformity.” The non-deformity cohort consisted of back pain patients with radiographic evidence of disc degeneration and clinically assessed chronic back pain. Back pain is multifactorial, and identification of a source of pain is complex, and often non-specific. Thus, the source of their pain remains undefined in this study; however, in the surgeon`s assessment the affected motion segment was contributing to the patient`s pain. Our second cohort, deformity, consisted of patients with olisthesis, rotational subluxation, obliquity, or scoliosis. Patients were categorized according to the surgeon`s assessment based on: a) clinical presentation; b) radiographic findings; and c) discography.
Clinical presentation included pain evaluation using VAS (included in 19 out of 20 patients), and assessment of pain patterns associated with sitting, bending over, and morning hours. These data were collected by standard patient intake questionnaires at initial visit and preoperatively, just before or during the clinic visit.
VAS was determined using a 10cm line with 0 on the left indicating “no pain” and 10 on the right indicating “worst possible pain.” Patients were instructed to mark the level of back pain/discomfort, with 0 being none and 10 being unbearable. No further instructions were provided regarding the timing of pain. They were asked to specify the duration of symptoms (including pain) in a separate question. For all patients except two, VAS scores were taken within one month of surgery.
-
b
Radiographic findings were used to evaluate degeneration and included the following: 1) plain films with qualitatively reduced height compared to adjacent discs; 2) T2-weighted MRI image demonstrating reduced nucleus signal and degeneration grade >3 using the Pfirrmann scale; and 3) endplate Modic changes. All patients were evaluated with plain films. MRI images were obtained for all non-deformity patients and six of the nine deformity patients, and disc height and Pfirrmann grade [11] were recorded when MRI was available. Disc height was measured from the center of the inferior endplate to center of the superior endplate.
-
c
Discography was conducted in eight out of eleven non-deformity discs, using a low-pressure injection technique (≤50 psi above opening pressure) for pain provocation [12]. Provocative discograms are rated by the quality and severity of pain provoked by injection of contrast medium into the intradiscal space. A positive disc was defined when: 1) concordant pain was provoked (≥ 7/10 VAS) before achieving the pressure limit; 2) a grade 3 annular tear was present; and 3) there was a negative control disc (≤6/10 VAS). Patients with a positive disc and degeneration were placed in the non-deformity cohort.
Patient diagnosis and resulting categorization was conducted by the treating clinician and entered into tissue storage. During a one year period, we collected samples from 80 patients (32 non-deformity and 48 deformity), and selected patients on a consecutive basis, after meeting tissue size limits for mechanical testing and extracellular matrix assays (≥3mm thick, ≥7mm width and length for indentation, ≥800mg for equilibrium dialysis, proteoglycan, collagen, and histology). The resulting study population was reduced to 20 patients (11 non-deformity and 9 deformity) after considering tissue size requirements. We analyzed 37 disc samples (approximately one nucleus pulposus (NP) and one annulus fibrosus (AF) sample per disc) from two patient groups: deformity (n=8 AF, n=9 NP), and non-deformity (n=11 AF, n=9 NP). Surgical extractions were partial by nature and some samples did not include annulus or nucleus tissue. Discs were primarily harvested between levels L4-S1, and one disc was harvested from L3-4.
Tissue Preparation
Tissues were frozen on dry ice within ten minutes of removal and subsequently stored at −80°C. Annulus and nucleus tissue were isolated by visual inspection: annulus tissue was apparent given its organized lamellar structure. The connective tissue surrounding the outer annulus was discarded. Nucleus samples were harvested from the central region of the disc consisting of unstructured collagen and proteoglycan. Tissue regions that were difficult to identify as annulus or nucleus were not analyzed.
Mechanical Indentation
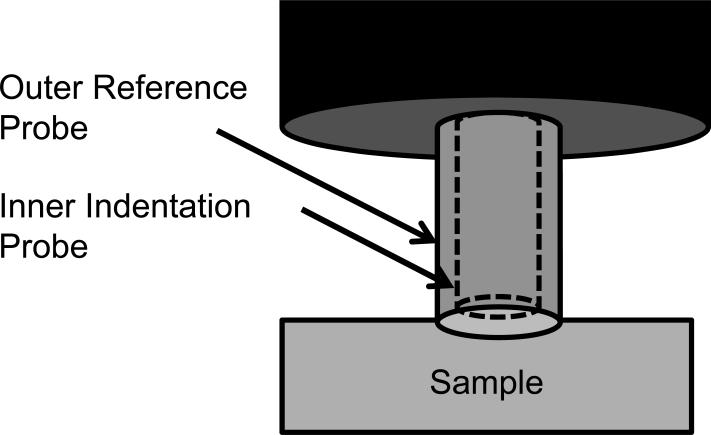
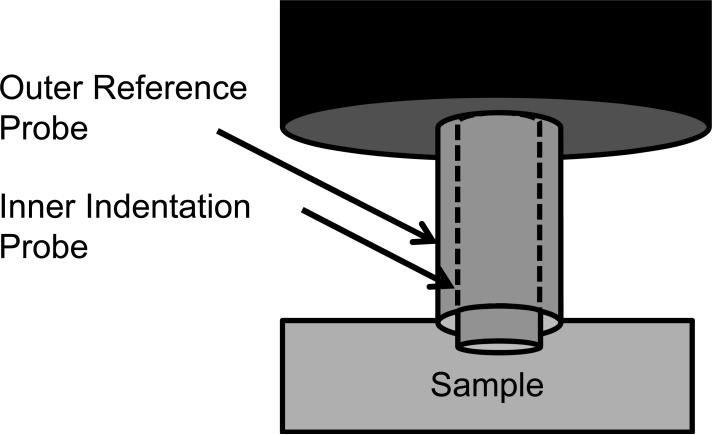
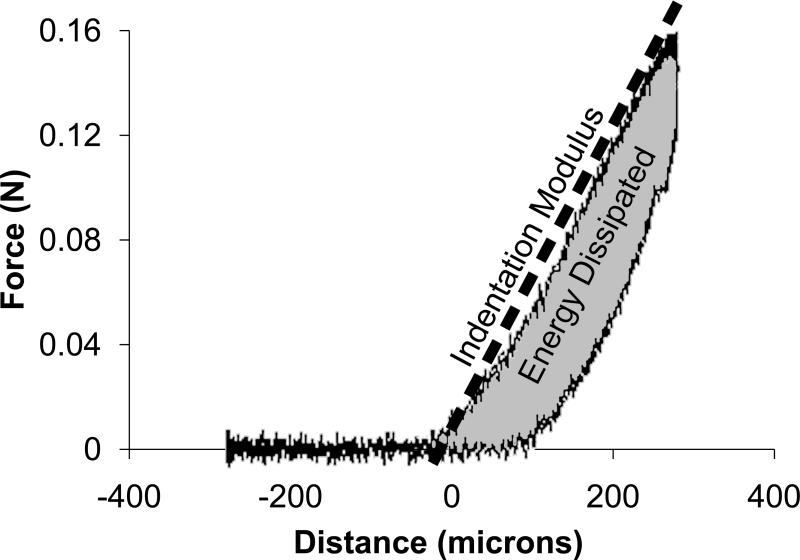
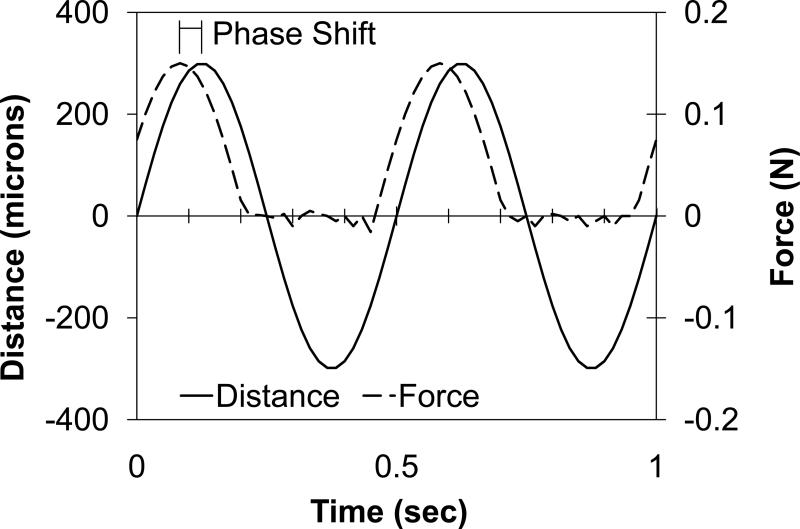
Because the samples were irregularly shaped, mechanical properties were tested using mechanical indentation. Dynamic indentation tests were performed with the samples submerged in 0.15 M PBS at 20°C (BioDent1000, Active Life Technologies, CA [13,14]). Using a reference probe to determine surface contact, a 1.47 mm diameter cylindrical probe continuously indented the tissue in a sinusoidal fashion with an amplitude of 300 μm and frequency of 2 Hz (Figs. 1a and 2b). Each sample was preconditioned for greater than 20 cycles to create a standard reference configuration with consistent local tissue hydration at the measurement site. During continuous indentation, two consecutive indentations were recorded and averaged to create a force-displacement curve. For each sample, five separate force-displacement curves were recorded in one location and output parameters extracted from each force-displacement curve were averaged. Annulus tissue was indented in the anatomic axial direction (i.e. perpendicular to the annular lamella) and nucleus tissue was indented without directional specification, due to the lack of definitive architectural features. The force-displacement curve exhibited hysteresis (Fig. 1c). The slope of the loading curve was used to quantify the indentation modulus. The area in the hysteresis loop was used to quantify the energy dissipated. As typical for viscoelastic materials, the displacement curve lagged the force curve (Fig. 1d). This lag in displacement is called phase shift, δ. The tangent of δ is the ratio of the loss to storage modulus, thus a large tangent of δ indicates a viscous material whereas a small tangent of δ indicates an elastic material.
Figure 1.
Mechanical indentation test. The outer reference probe contacted the sample (a) and the inner indentation probe indented the sample (b) while recording force-displacement data. Energy dissipation and indentation modulus were extracted from the resulting force-displacement curve (c). The phase shift, δ, was recorded from the lag between force and distance (d).
Figure 2.
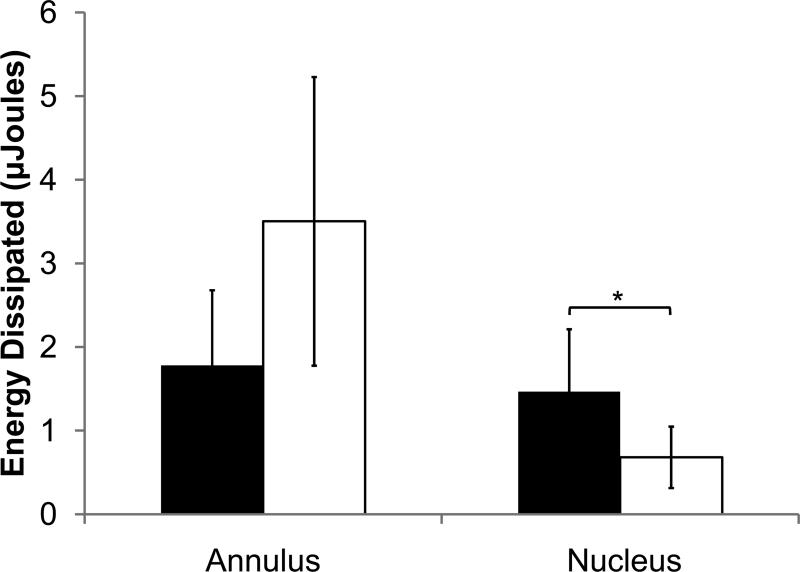
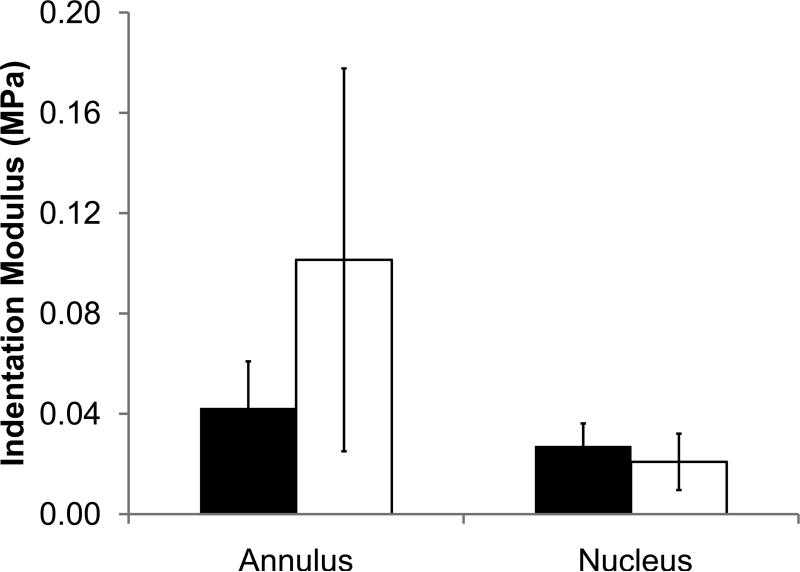
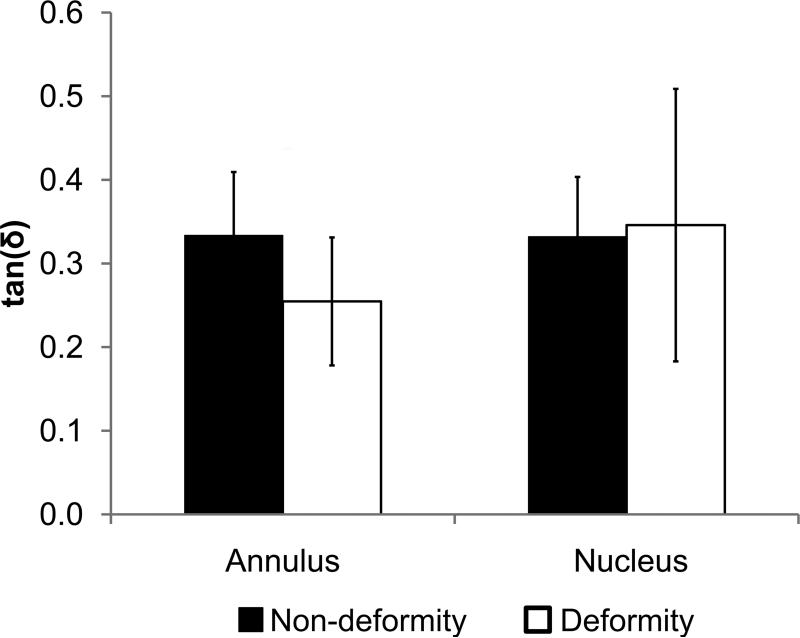
Mechanical indentation test output parameters of non-deformity and deformity discs for nucleus and annulus. (a) Energy dissipation. (b) Indentation modulus. (c) tan(δ). Values are means ± SD. *ppain<0.05 by ANCOVA.
Equilibrium Dialysis
The disc hydration at physiologic pressure was assessed using equilibrium dialysis – a technique that applies osmotic pressure on samples. Swelling pressure was measured by equilibrium dialysis as described previously [15]. Briefly, tissue samples were equilibrated in polyethylene glycol 20000 (PEG) solutions with 0.15 M sodium chloride, which generated an osmotic pressure. A 30-60 mg tissue slice was placed into dialysis tubing of 3500 MW cutoff, and subsequently submerged into the PEG solution. This was repeated such that each specimen was divided into six slices and placed in six different PEG concentrations (5, 10, 15, 20, 25, and 30 g PEG/100 ml sodium chloride). After 48 hours at 4°C with gentle agitation, the post-dialysis tissue mass was measured. The tissue slices were lyophilized and the resulting dry masses measured. Dry mass was subtracted from the post-dialysis tissue mass to obtain water content. The water content was normalized to dry mass to obtain tissue hydration. After each experiment, a sample of each PEG solution was lyophilized and weighed to obtain the final PEG concentration. The osmotic pressures of the PEG solutions were calculated using the following equation:
| Equation 1 |
where π is the osmotic pressure, R is 8.31 J/K*mol, T is temperature, c is concentration in g PEG/ml solution (specific volume of PEG is 0.837 ml/g).
Osmotic pressure versus tissue hydration curves were generated and the data were fit to an equation of the form π = A × hB, where h is tissue hydration, and A and B are constants. The hydration at 0.2 MPa (a physiologic disc pressure [16]) was compared between non-deformity and deformity samples. In addition, the dependence of hydration on proteoglycan and collagen content in the combined set of tested tissues was evaluated by performing a multiple linear regression with the following equation:
| Equation 2 |
where h is tissue hydration, p is proteoglycan normalized to dry mass, c is collagen content normalized to dry mass, and A1, A2, and A3 are constants. The individual dependence of tissue hydration on proteoglycan and collagen was evaluated with two linear regression analyses.
Protein Quantification
Proteoglycan, collagen, and collagen crosslinking were quantified to determine if matrix quantity correlated with mechanical properties.
Proteoglycan
Samples were digested with papain (21 units/ml) at 65°C for 48 hours. Chondroitin sulfate content was assessed by adding 40 ul of the papain digest to 250 ul dimethylmethylene blue dye (DMMB) solution [17]. Absorbance at 525 nm was measured and converted using a chondroitin sulfate standard.
Collagen
Samples were digested with 6 N HCl at 110°C for 16 hours. Collagen content was assessed by hydroxyproline, as described by others [18]. Absorbance at 570 nm was measured and converted using a hydroxyproline standard. Collagen was assumed to consist of 14% hydroxyproline [19].
Collagen crosslinking was assessed by quantifying fluorescent advanced glycation endproducts (AGEs) [20]. Supernatant from the collagen digest was measured by fluorescence at 370 nm excitation and 440 nm emission and converted with a quinine sulfate standard.
Histology
Disc samples were embedded in paraffin, sectioned, and stained with Picrosirius Red. Sections were imaged at 4X under polarized light to visualize collagen birefringence.
Statistical Analysis
All statistical analyses were performed using the JMP statistical software system (JMP V 8.0.1). Student's t-test and analysis of covariance (ANCOVA) procedures were used to compare specimen group means and to estimate the effect of the specimen variables (tissue type, non-deformity/deformity status entered as categorical predictors; and age entered as a continuous predictor) on the measured parameters of interest (energy dissipated; indentation modulus; tan(δ); hydration; proteoglycan, collagen, and collagen crosslinking content). Correlation coefficients (coefficient of determination, R2), standard deviations, and linear regressions were also determined along with standard p-values for assessing statistical significance. Probabilities between 0.05<p<0.1 were defined as ‘trends’ with near statistical significance [21].
The current study investigates differences in mechanical properties and matrix quality, which are confounded with degeneration and, therefore, age. We have accounted for age effects by performing ANCOVA with age as the corrected variable. Our analysis outputs include p values for age and deformity group, such that significance can be assessed for each.
Results
Patient Selection
VAS scoring (available for 35 out of 37 samples) was significantly higher in the non-deformity than deformity group (8±2 vs 5±3 (SD), p<0.05). MRI data was available for 32 out of the 37 tested samples. Disc heights between the non-deformity (11.5±2.5 mm) and deformity (12.2±1.2 mm) groups were statistically indistinguishable (p>0.4). In addition, Pfirrmann grades between non-deformity (median=3, range=2) and deformity (median=3, range=1) groups were statistically equivalent by Pearson's chi-square test (p>0.7). The age of the non-deformity group was significantly lower than that of the deformity group (49±10 vs. 61±14, p<0.01). Males and females were represented in the non-deformity group (4 female/7 male) and deformity group (6 female/3 male); gender distribution between groups was statistically indistinguishable by Pearson's chi-square test (p>0.15).
Mechanical Indentation
The non-deformity and deformity groups had subtle differences in mechanical properties based on indentation testing. In nucleus samples, energy dissipation was significantly higher in the non-deformity group than in the deformity group after including age effects (1.5±0.7 vs. 0.7±0.4 μJ, R2=0.33, ppain<0.05, page=0.985). For the annulus samples, energy dissipation was statistically indistinguishable between the non-deformity group and deformity group after including age effects (Fig. 2a; 1.8±0.9 vs. 3.5±1.7 μJ, R2=0.47, ppain=0.215, page=0.055). Other indentation outputs (indentation modulus and tangent of δ) for non-deformity and deformity groups (nucleus and annulus) were statistically indistinguishable when including age effects.
Within the non-deformity group, energy dissipation between the nucleus and annulus were statistically indistinguishable (p=0.41). In contrast, in the deformity disc, energy dissipation of the annulus was significantly higher than the nucleus (p<0.0005). While the indentation modulus of the annulus was significantly higher than that of the nucleus in both non-deformity and deformity discs (p<0.05), the mean difference between nucleus and annulus indentation modulus was larger in the deformity disc. Because the majority if samples included both annulus and nucleus tissues, comparisons between annulus and nucleus were largely the same age and not age corrected.
Equilibrium Dialysis
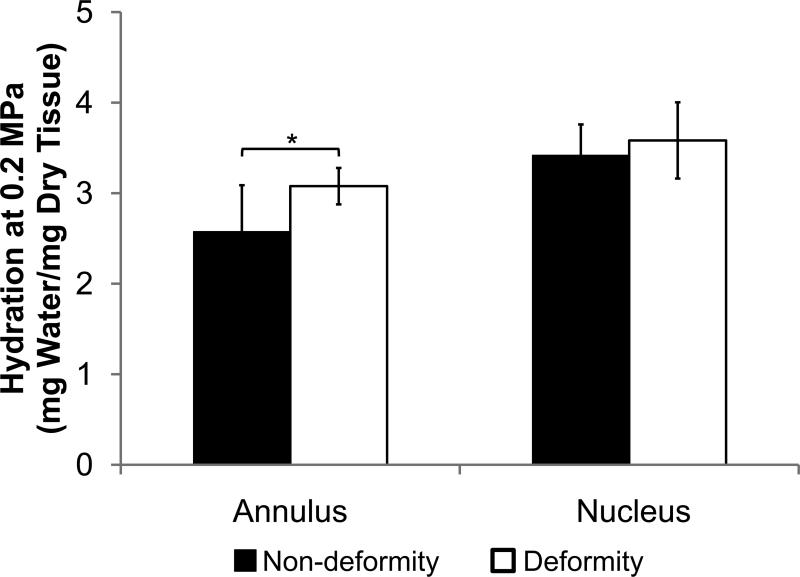
The non-deformity and deformity annulus samples had different equilibrium water content by equilibrium dialysis. At an osmotic pressure that approximates physiologic pressure in the disc, the hydration of the annulus was significantly lower in the non-deformity group than the deformity group after including age effects (Fig. 3; 2.6±0.5 vs. 3.1±0.2 MPa, R2=0.42, ppain<0.005, page=0.077). In contrast, the hydration of the non-deformity and deformity nucleus samples were statistically indistinguishable (R2=0.13, ppain=0.17, page=0.27). In both non-deformity and deformity groups, the nucleus had significantly higher hydration than the annulus (p<0.01).
Figure 3.
Hydration at 0.2 MPa of non-deformity and deformity discs for nucleus and annulus. Values are means ± SD. * ppain<0.05 by ANCOVA.
The hydration for the combined set of tested tissues was dependent on proteoglycan and collagen content according to Equation 2. Multiple linear regression analysis indicated that constants A1 through A3 in Equation 2 are , , and , respectively. The R2 value of the curve fit was 0.43. In addition, the linear regression analyses indicated that tissue hydration had individual correlations with proteoglycan (R=0.45, p<0.01) and collagen (R=-0.55, p<0.0005).
Protein Quantification
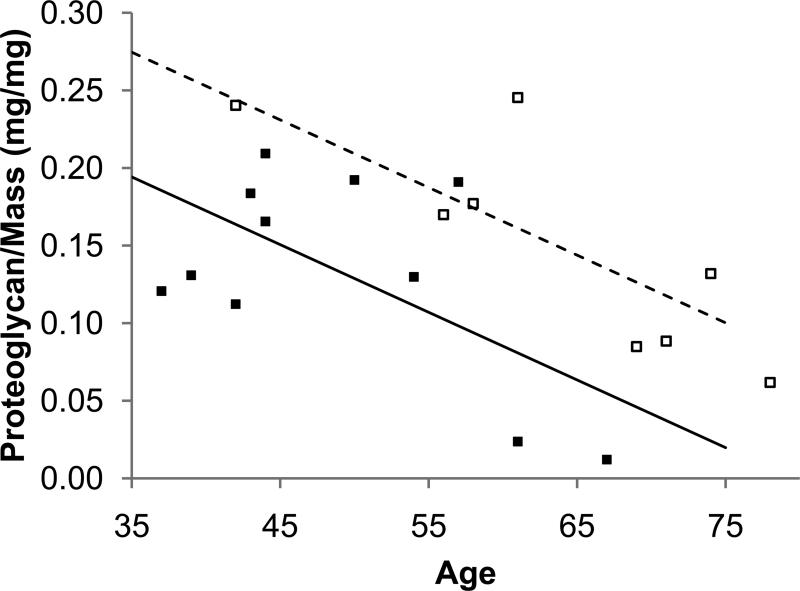
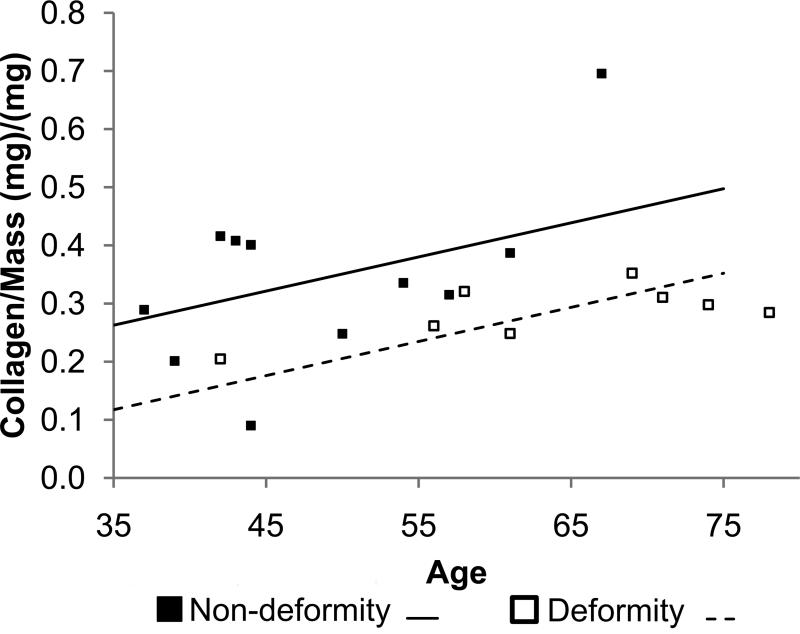
The non-deformity and deformity groups had similar amounts of proteoglycan and collagen (Table 1). Including age as a covariate, however, revealed differences in matrix content between the non-deformity and deformity annulus (Fig. 4). Specifically, the non-deformity annulus had lower proteoglycan and higher collagen than the deformity annulus after correcting for age effects (proteoglycan: R2=0.47, ppain <0.05, page <0.005; collagen: R2=0.31, ppain<0.05, page<0.05). As expected, total collagen was higher in the annulus than the nucleus in both groups (p<0.05). Collagen crosslinking was statistically indistinguishable between non-deformity and deformity groups (annulus and nucleus)
Table 1.
Matrix quantification of non-deformity and deformity discs for nucleus and annulus.
| Nucleus Pulposus | Annulus Fibrosus | |||
|---|---|---|---|---|
| Non-deformity | Deformity | Non-deformity | Deformity | |
| Proteoglycan/Dry Mass (μg/mg) | 160±77 | 138±102 | 134±66 | 150±70 |
| Collagen/Dry Mass (μg/mg) | 228±45 | 187±70 | 344±154* | 285±46* |
| Collagen Crosslinking (ng Quinine/μg Collagen) | 5.21±1.52 | 9.15±6.39 | 3.67±2.85 | 4.16±0.43 |
Values are means ± SD.
Indicates significant difference between annulus and nucleus. p<0.05.
Figure 4.
The effect of age and pain on matrix quantity in the annulus. The non-deformity annulus had less proteoglycan (a) and more collagen (b) than the deformity annulus.
Histology
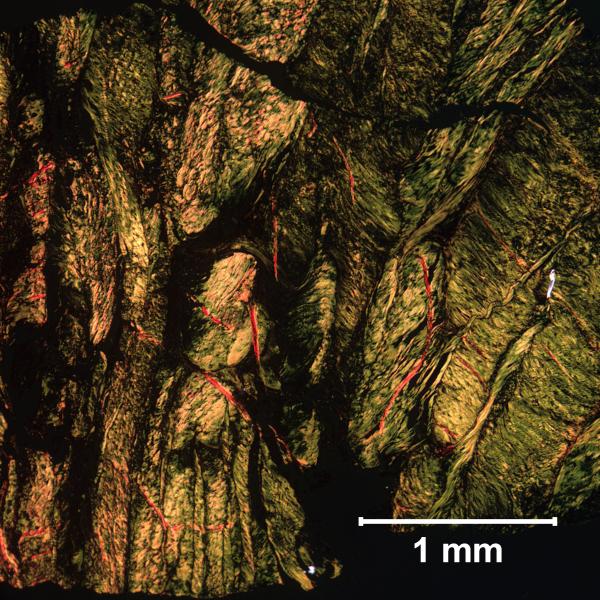
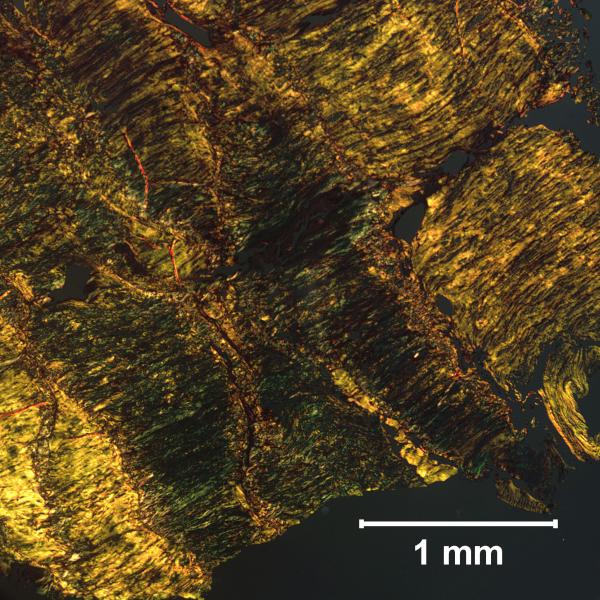
The matrix organization of the non-deformity annulus was compromised compared to that of the deformity annulus. This has been reported in the literature, and confirmed with histology in the current study (Fig. 5) [1]. Representative sections indicate that the non-deformity annulus had disorganized collagen lamellae. In contrast, the organization of the deformity annulus was evident from the clear structure of the lamellae. Although these data were not age adjusted, trends in matrix organization are opposite to expected age effects. In particular, disorganized collagen lamellae was observed in the younger non-deformity annulus, rather than the older deformity annulus.
Figure 5.
Annulus samples stained with Picrosirius Red under polarized light. The non-deformity annulus (a) had disorganized lamellar structure compared to the deformity annulus (b).
Discussion
The current study used non-deformity discs with deformity controls to open the door for future research regarding back pain and the intervertebral disc. Our data demonstrate that non-deformity discs have subtle differences in mechanical properties and annular matrix quantity, while maintaining similar levels of nuclear matrix quantity, as deformity discs. Surprisingly, this is despite having similar levels of degeneration—assessed by MRI Pfirrmann grade, disc height, nucleus viscoelasticity, nucleus hydration, and nucleus proteoglycan quantity. We observed that the non-deformity annulus had a diminished ability to imbibe water, which coincided with decreased proteoglycan and increased collagen. The non-deformity nucleus had higher energy dissipation than the deformity nucleus. Taken together, these results suggest that subtle mechanical and biochemical changes are present in the discs of patients undergoing segmental fusion or disc replacement for disc degeneration and chronic back pain.
Due to limitations involving clinical diagnostics, the current study cannot compare painful and non-painful discs. Prior research has characterized the degenerated disc using a combination of clinical data and animal models. In contrast, characteristics of painful discs remain poorly defined. Investigations of the painful disc pose challenges stemming from the subjectivity of pain. Without a representative animal model, disc pain research is conducted using human surgical waste tissue where pain classification remains controversial. Self-reported pain scales (VAS) are subjective and do not identify whether the pain source is the disc or surrounding tissue. On the other hand, discogram identifies the specific pain level, but remains controversial due to false-positives and an invasive procedure. The design of the current study was such that discogram was not applied to deformity patients as an ethical limitation. Future research will investigate discogenic pain using a universal standard for disc pain that can be applied to all patients. The current study, instead, investigates discs of patients undergoing segmental fusion or disc replacement for disc degeneration and chronic back pain using the non-deformity group.
Our results suggest unique matrix properties in the non-deformity annulus that have been observed previously in painful discs. In particular, our results indicate that the non-deformity annulus have quantifiable changes including decreased proteoglycan and increased collagen compared to deformity controls. Changes in collagen structure and distribution have been observed in prior studies focused on painful discs. Previous reports demonstrate that the annulus of painful discs has distinct histological features, including disordered annulus lamellar structure and infiltration of vascular granulation tissue [1]. These findings were accompanied by observations of increased connective tissue growth factor in the painful disc, which suggests fibrosis in the disc matrix. While the current study does not assess vascular granulation tissue or connective tissue growth factor, our histologic data of the non-deformity disc also demonstrate disorganized annulus lamellar structure.
Altered matrix in the non-deformity disc leads to diminished hydration characteristics. When exposed to an osmotic pressure of 0.2 MPa during equilibrium dialysis tests, the non-deformity annulus was less hydrated than the deformity annulus. These results suggest that the non-deformity annulus had inferior mechanical properties. As expected, tissue hydration correlated with proteoglycan and collagen quantity (Equation 2), confirming that matrix quantity approximately predicts matrix function. In addition, altered collagen structure, which is found in the non-deformity disc, can affect collagen intrafibrillar water content and disc hydration [22]. These subtle changes in annulus properties were not detected by indentation testing.
In the nucleus of the non-deformity disc, we noted increased energy dissipation without associated changes in proteoglycan or collagen quantity. By measuring the structural properties of proteoglycan and collagen, our indentation tests detected altered matrix in the non-deformity nucleus. Mechanical indentation, like other compressive testing protocols, measures compressive properties of the nucleus which are dominated by proteoglycans and surface tensile properties of collagen fibrils located at the superficial tissue region [23,24]. While differences in mechanical indentation were not explained by proteoglycan and collagen quantification, DMMB and hydroxyproline do not fully define the matrix properties of the nucleus. In painful discs, the presence of fibrosis and infiltration of vascular granulation tissue extends into the nucleus [1], which could cause elevated energy dissipation without altered proteoglycan or collagen quantity. In addition, several less abundant extracellular matrix molecules in the nucleus affect matrix integrity and mechanical properties. For example, collagen IX covalently binds collagen II and its role in matrix function has been demonstrated in studies of genetic polymorphisms [25]. These studies have identified links between collagen IX polymorphisms and disc degeneration or compromised mechanical properties in the nucleus [26,27].
Mechanical indentation data indicate that the annulus and nucleus have similar mechanical properties in the non-deformity disc, but different properties in the deformity disc. Specifically, in the deformity disc, the nucleus had lower energy absorption and indentation modulus than the annulus. These properties are consistent with the existing knowledge of disc biomechanics, where the hydrated nucleus is surrounded by the organized annulus, evenly distributing load along the neighboring vertebral bodies. As the disc degenerates, the nucleus dehydrates and the annular collagen infiltrates the nucleus, resulting in loss of distinction between the annulus and nucleus [11,28]. These degenerative changes were evident in the non-deformity disc group from our mechanical indentation results. The similar mechanical properties of the nucleus and annulus in non-deformity discs are a departure from typical nucleus and annulus function, where the structured annulus contains the gelatinous nucleus. While the non-deformity and deformity discs had similar degeneration grades (indicated by Pfirrmann grade, disc height, nucleus viscoelasticity, nucleus hydration, and nucleus proteoglycan quantity), these mechanical properties indicating a change in nucleus and annulus function were specific to non-deformity discs. Thus, our data suggest subtle degenerative changes in non-deformity discs that are independent of the standard indicators of disc degeneration. Interestingly, these degenerative effects are observed in the younger non-deformity group.
This study included limitations that arose from the challenges associated with surgical patient selection and group designation. The first was that we used clinical assessment with discogram to test discogenic pain in our hypothesis. Although discogram is used in clinics to confirm discogenic pain, it remains a controversial technique with reports of false-positives ranging from 6% to 83% [12,29,30]. Variation in false positives is attributable to study factors, such as inclusion of subjects with preexisting chronic pain or somatization disorder. Nevertheless, the combination of clinical parameters, including discogram, is currently the best assessment of discogenic pain. As a practical limitation, the deformity group did not include discography. Because discogram is invasive and clinically unnecessary in deformity patients, we instead relied on clinical assessment and radiographs for the deformity group. A second limitation was that the control deformity group consisted primarily of adult scoliotic discs, which may have had tissue asymmetries or altered matrix. The use of scoliotic discs is a practical limitation since degenerated asymptomatic discs are infrequently removed from patients other than those with deformity. These scoliotic discs have a history of asymmetric loading and the potential for regional variation in tissue properties. However, prior studies that compare matrix from the convex and concave sides of the scoliotic curve have poor agreement. Some studies have indicated heterogeneity in collagen content and crosslinking between the convex and concave scoliotic disc [31,32]. Other studies, however, have indicated no differences between the convex and concave matrix by histology, collagen content, or proteoglycan content [33–35]. We did not control for tissue asymmetry, which possibly contributed to variability in our mechanical measures. Nonetheless our results were statistically significant when compared to the non-deformity disc group. Aside from tissue asymmetry, scoliotic discs may also have altered matrix. Others have shown that scoliotic discs have reduced annular elastin and collagen organization [33]; however, this would suggest mechanical trends opposite to those reported here. Consequently, we do not believe the presence of scoliosis biases our mechanical data. Another limitation was the age difference between groups. Previous studies have shown that older age results in increased AGEs and degeneration [32,36]. Despite the age differences between groups, AGEs were statistically indistinguishable between non-deformity and deformity groups for both nucleus and annulus tissue. The degeneration level between groups was similar, as demonstrated by Pfirrmann grade, disc height, nucleus viscoelasticity, nucleus hydration, and nucleus proteoglycan quantity. Furthermore, the deformity annulus group (higher mean age) had higher tissue hydration than the non-deformity annulus group. This is contrary to an expected degenerative-age effect in the annulus, which has been shown by others to result in increased compressive modulus from tissue dehydration [6].
While the source of disc pain remains under investigation, the current study enhances the existing knowledge of compromised mechanical and matrix properties specific to discs of patients undergoing segmental fusion or disc replacement for disc degeneration and chronic back pain. Panjabi has previously described the spinal column as part of the stabilizing system of the spine [37]. Instability in the spinal column can be induced in cadaveric spinal units by introducing annular or nuclear defects to the disc [38]. While prior experiments have demonstrated the relationship between intervertebral disc injury and clinical instability, the association between instability and low back pain has remained an assumption [37].
Interestingly, this assumption is the basis for spine stabilization treatment, including fusion and muscle strengthening [37]. Results from the current study support this assumption by suggesting an association between compromised tissue mechanical properties and disc degeneration with chronic back pain. Although we were unable to directly test spinal instability, our results open the door for further investigation in the mechanics of painful discs. We are unaware of any previous study that has assessed the mechanical properties of discs from patients undergoing segmental fusion or disc replacement for disc degeneration and chronic back pain using deformity controls.
Acknowledgements
The authors thank Simon Tang, Ph.D. for support with indentation testing.
This study was approved by the UCSF Committee for Human Research H8317-34145-041
Acknowledge fund: NIH R01AR52811 and National Science Foundation Graduate Research Fellowship
Footnotes
Publisher's Disclaimer: This is a PDF file of an unedited manuscript that has been accepted for publication. As a service to our customers we are providing this early version of the manuscript. The manuscript will undergo copyediting, typesetting, and review of the resulting proof before it is published in its final citable form. Please note that during the production process errors may be discovered which could affect the content, and all legal disclaimers that apply to the journal pertain.
References
- 1.Peng B, Chen J, Kuang Z, Li D, Pang X, Zhang X. Expression and role of connective tissue growth factor in painful disc fibrosis and degeneration. Spine. 2009;34:E178–182. doi: 10.1097/BRS.0b013e3181908ab3. [DOI] [PubMed] [Google Scholar]
- 2.Lotz JC, Kim AJ. Disc regeneration: why, when, and how. Neurosurg. Clin. N. Am. 2005;16:657–663. vii. doi: 10.1016/j.nec.2005.06.004. [DOI] [PubMed] [Google Scholar]
- 3.Leung VYL, Chan D, Cheung KMC. Regeneration of intervertebral disc by mesenchymal stem cells: potentials, limitations, and future direction. Eur Spine J. 2006;15(Suppl 3):S406–413. doi: 10.1007/s00586-006-0183-z. [DOI] [PMC free article] [PubMed] [Google Scholar]
- 4.Iatridis JC, Setton LA, Weidenbaum M, Mow VC. Alterations in the mechanical behavior of the human lumbar nucleus pulposus with degeneration and aging. J. Orthop. Res. 1997;15:318–22. doi: 10.1002/jor.1100150224. [DOI] [PubMed] [Google Scholar]
- 5.Johannessen W, Elliott DM. Effects of degeneration on the biphasic material properties of human nucleus pulposus in confined compression. Spine. 2005;30:E724–729. doi: 10.1097/01.brs.0000192236.92867.15. [DOI] [PubMed] [Google Scholar]
- 6.Iatridis JC, Setton LA, Foster RJ, Rawlins BA, Weidenbaum M, Mow VC. Degeneration affects the anisotropic and nonlinear behaviors of human anulus fibrosus in compression. J Biomech. 1998;31:535–44. doi: 10.1016/s0021-9290(98)00046-3. [DOI] [PubMed] [Google Scholar]
- 7.Boden SD, Davis DO, Dina TS, Patronas NJ, Wiesel SW. Abnormal magnetic-resonance scans of the lumbar spine in asymptomatic subjects. A prospective investigation. J Bone Joint Surg Am. 1990;72:403–8. [PubMed] [Google Scholar]
- 8.Borenstein DG, O'Mara JW, Boden SD, et al. The value of magnetic resonance imaging of the lumbar spine to predict low-back pain in asymptomatic subjects : a seven-year follow-up study. J Bone Joint Surg Am. 2001;83-A:1306–11. doi: 10.2106/00004623-200109000-00002. [DOI] [PubMed] [Google Scholar]
- 9.Peng B, Wu W, Hou S, Li P, Zhang C, Yang Y. The pathogenesis of discogenic low back pain. J Bone Joint Surg Br. 2005;87:62–7. [PubMed] [Google Scholar]
- 10.Peng B, Hao J, Hou S, et al. Possible pathogenesis of painful intervertebral disc degeneration. Spine. 2006;31:560–6. doi: 10.1097/01.brs.0000201324.45537.46. [DOI] [PubMed] [Google Scholar]
- 11.Pfirrmann CW, Metzdorf A, Zanetti M, Hodler J, Boos N. Magnetic resonance classification of lumbar intervertebral disc degeneration. Spine. 2001;26:1873–8. doi: 10.1097/00007632-200109010-00011. [DOI] [PubMed] [Google Scholar]
- 12.Wolfer LR, Derby R, Lee J-E, Lee S-H. Systematic review of lumbar provocation discography in asymptomatic subjects with a meta-analysis of false-positive rates. Pain Physician. 2008;11:513–38. [PubMed] [Google Scholar]
- 13.Hansma P, Yu H, Schultz D, et al. The tissue diagnostic instrument. Rev Sci Instrum. 2009;80:054303. doi: 10.1063/1.3127602. [DOI] [PMC free article] [PubMed] [Google Scholar]
- 14.Schultz DS, Rodriguez AG, Hansma PK, Lotz JC. Mechanical profiling of intervertebral discs. J Biomech. 2009 doi: 10.1016/j.jbiomech.2009.02.013. [DOI] [PMC free article] [PubMed] [Google Scholar]
- 15.Urban JP, McMullin JF. Swelling pressure of the lumbar intervertebral discs: influence of age, spinal level, composition, and degeneration. Spine. 1988;13:179–87. doi: 10.1097/00007632-198802000-00009. [DOI] [PubMed] [Google Scholar]
- 16.Wilke HJ, Neef P, Caimi M, Hoogland T, Claes LE. New in vivo measurements of pressures in the intervertebral disc in daily life. Spine. 1999;24:755–62. doi: 10.1097/00007632-199904150-00005. [DOI] [PubMed] [Google Scholar]
- 17.Farndale RW, Sayers CA, Barrett AJ. A direct spectrophotometric microassay for sulfated glycosaminoglycans in cartilage cultures. Connect. Tissue Res. 1982;9:247–8. doi: 10.3109/03008208209160269. [DOI] [PubMed] [Google Scholar]
- 18.Woessner JF. The determination of hydroxyproline in tissue and protein samples containing small proportions of this imino acid. Arch. Biochem. Biophys. 1961;93:440–7. doi: 10.1016/0003-9861(61)90291-0. [DOI] [PubMed] [Google Scholar]
- 19.Colgrave ML, Allingham PG, Jones A. Hydroxyproline quantification for the estimation of collagen in tissue using multiple reaction monitoring mass spectrometry. Journal of Chromatography A. 2008;1212:150–3. doi: 10.1016/j.chroma.2008.10.011. [DOI] [PubMed] [Google Scholar]
- 20.Monnier VM, Kohn RR, Cerami A. Accelerated age-related browning of human collagen in diabetes mellitus. Proc. Natl. Acad. Sci. U.S.A. 1984;81:583–7. doi: 10.1073/pnas.81.2.583. [DOI] [PMC free article] [PubMed] [Google Scholar]
- 21.Desbiens NA. A novel use for the word “trend” in the clinical trial literature. Am. J. Med. Sci. 2003;326:61–5. doi: 10.1097/00000441-200308000-00002. [DOI] [PubMed] [Google Scholar]
- 22.Sivan S, Merkher Y, Wachtel E, Ehrlich S, Maroudas A. Correlation of swelling pressure and intrafibrillar water in young and aged human intervertebral discs. J. Orthop. Res. 2006;24:1292–8. doi: 10.1002/jor.20144. [DOI] [PubMed] [Google Scholar]
- 23.Korhonen RK, Laasanen MS, Töyräs J, et al. Comparison of the equilibrium response of articular cartilage in unconfined compression, confined compression and indentation. J Biomech. 2002;35:903–9. doi: 10.1016/s0021-9290(02)00052-0. [DOI] [PubMed] [Google Scholar]
- 24.Umehara S, Tadano S, Abumi K, Katagiri K, Kaneda K, Ukai T. Effects of degeneration on the elastic modulus distribution in the lumbar intervertebral disc. Spine. 1996;21:811–819. doi: 10.1097/00007632-199604010-00007. discussion 820. [DOI] [PubMed] [Google Scholar]
- 25.Diab M, Wu JJ, Eyre DR. Collagen type IX from human cartilage: a structural profile of intermolecular cross-linking sites. Biochem. J. 1996;314(Pt 1):327–32. doi: 10.1042/bj3140327. [DOI] [PMC free article] [PubMed] [Google Scholar]
- 26.Annunen S, Paassilta P, Lohiniva J, et al. An allele of COL9A2 associated with intervertebral disc disease. Science. 1999;285:409–12. doi: 10.1126/science.285.5426.409. [DOI] [PubMed] [Google Scholar]
- 27.Aladin DMK, Cheung KMC, Chan D, et al. Expression of the Trp2 allele of COL9A2 is associated with alterations in the mechanical properties of human intervertebral discs. Spine. 2007;32:2820–6. doi: 10.1097/BRS.0b013e31815b75c5. [DOI] [PubMed] [Google Scholar]
- 28.Thompson JP, Pearce RH, Schechter MT, Adams ME, Tsang IK, Bishop PB. Preliminary evaluation of a scheme for grading the gross morphology of the human intervertebral disc. Spine. 1990;15:411–5. doi: 10.1097/00007632-199005000-00012. [DOI] [PubMed] [Google Scholar]
- 29.Manchikanti L, Datta S, Derby R, Wolfer LR, Benyamin RM, Hirsch JA. A critical review of the American Pain Society clinical practice guidelines for interventional techniques: part 1. Diagnostic interventions. Pain Physician. 2010;13:E141–174. [PubMed] [Google Scholar]
- 30.Carragee EJ, Tanner CM, Khurana S, et al. The rates of false-positive lumbar discography in select patients without low back symptoms. Spine. 2000;25:1373–1380. doi: 10.1097/00007632-200006010-00009. discussion 1381. [DOI] [PubMed] [Google Scholar]
- 31.Bushell GR, Ghosh P, Taylor TK, Sutherland JM. The collagen of the intervertebral disc in adolescent idiopathic scoliosis. J Bone Joint Surg Br. 1979;61-B:501–8. doi: 10.1302/0301-620X.61B4.500764. [DOI] [PubMed] [Google Scholar]
- 32.Duance VC, Crean JK, Sims TJ, et al. Changes in collagen cross-linking in degenerative disc disease and scoliosis. Spine. 1998;23:2545–51. doi: 10.1097/00007632-199812010-00009. [DOI] [PubMed] [Google Scholar]
- 33.Yu J, Fairbank JCT, Roberts S, Urban JPG. The elastic fiber network of the anulus fibrosus of the normal and scoliotic human intervertebral disc. Spine. 2005;30:1815–20. doi: 10.1097/01.brs.0000173899.97415.5b. [DOI] [PubMed] [Google Scholar]
- 34.Pedrini-Mille A, Pedrini VA, Tudisco C, Ponseti IV, Weinstein SL, Maynard JA. Proteoglycans of human scoliotic intervertebral disc. J Bone Joint Surg Am. 1983;65:815–23. [PubMed] [Google Scholar]
- 35.Bibby SRS, Fairbank JCT, Urban MR, Urban JPG. Cell viability in scoliotic discs in relation to disc deformity and nutrient levels. Spine. 2002;27:2220–2228. doi: 10.1097/00007632-200210150-00007. discussion 2227–2228. [DOI] [PubMed] [Google Scholar]
- 36.Adams MA, Roughley PJ. What is intervertebral disc degeneration, and what causes it? Spine. 2006;31:2151. doi: 10.1097/01.brs.0000231761.73859.2c. [DOI] [PubMed] [Google Scholar]
- 37.Panjabi MM. Clinical spinal instability and low back pain. J Electromyogr Kinesiol. 2003;13:371–9. doi: 10.1016/s1050-6411(03)00044-0. [DOI] [PubMed] [Google Scholar]
- 38.Panjabi MM, Krag MH, Chung TQ. Effects of disc injury on mechanical behavior of the human spine. Spine. 1984;9:707–13. doi: 10.1097/00007632-198410000-00010. [DOI] [PubMed] [Google Scholar]


