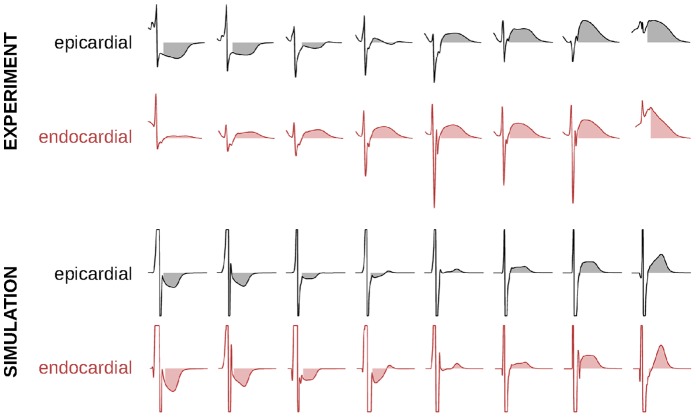
Figure 4. Examples of unipolar epicardial and noncontact endocardial electrograms measured (normalized) at corresponding epi- and endocardial sites (both experimental and simulated).
The area under the atrial T wave is displayed as a shaded area. Simulated signals are saturated to highlight their atrial T wave.

