
Figure 1.
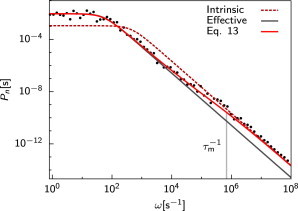
The power spectrum of the receptor state Pn(ω) for c = 0.4 μM. The simulation results (black circles) agree well with the theoretical prediction of Eq. 13 (solid red line). At high frequencies ω > 1/τm = D/σ2, the effect of diffusion is negligible and the receptor dynamics is that of a Markovian switching process with intrinsic rates kac and kd (dashed red line), while at low frequencies it is that of a Markovian switching process with effective rates konc and koff, respectively (solid gray line). The zero-frequency limit determines the precision of the concentration estimate. Parameters: , D = 1 μm2 s−1, σ = 10 nm, L = 1 μm, and ka = 552 μM−1 s−1. To see this figure in color, go online.