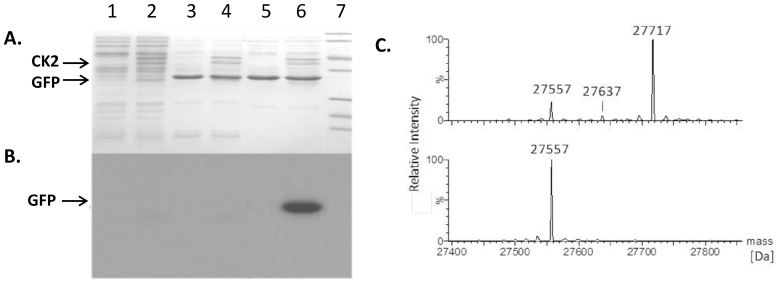
Figure 1. Analysis of phosphorylation of GFP28 with CK2.
A and B: SDS PAGE analysis. Coomassie brilliant blue staining (A) and x-ray film (B). The lane numbers corresponds both to A and B. Lanes 1, 2: Protein extract without GFP; Lanes 3, 4: Protein extract with GFP0 (no tag); Lane 5, 6: Protein extract with GFP28. Lanes 2, 4 and 6 is treated with CK2 (in B the radioactive labeling is performed with 32P-ATP). Lane 7: markers (116, 66, 45, 35, 25, 18 and 14 kDa). C: ESI-MS spectrum showing GFP28 phosphorylation. Cell lysates containing GFP28 before (lower spectrum) and after treatment with CK2 (upper spectrum).

