
Figure 3.
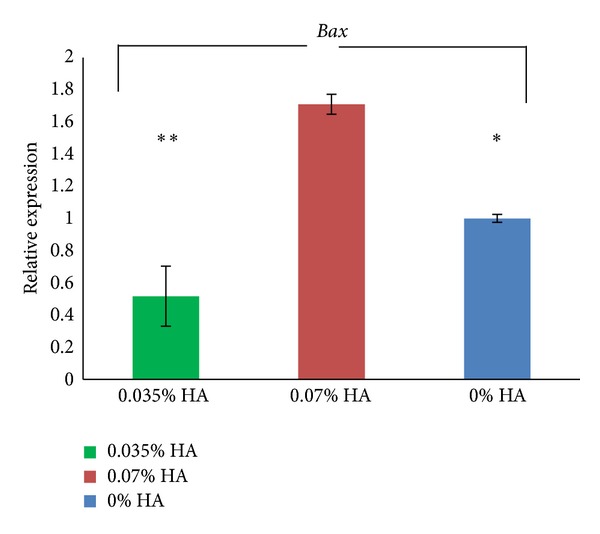
Relative mRNA expressions (mean ± SD) for Bax in granulosa cells which served as coculture during IVM of oocytes cultured with addition of 0.035% HA, 0.07% HA, and control. The significant differences were noted **(P < 0.01), *(P < 0.05) (ANOVA followed by Tuckey's post hoc test)