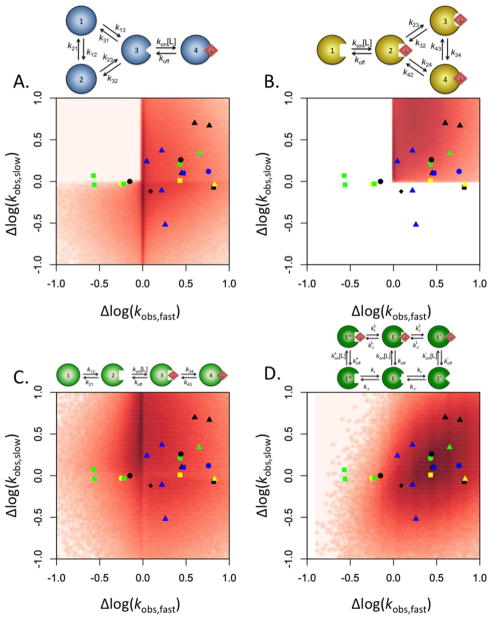
Figure 6. Mapping of the kinetic behavior of the general conformational selection and induced fit schemes.
Distribution of the range of the two saturable kobs, computed as the ratio between the values for [L]=∞ and [L]=0, and plotted as the slow relaxation vs the fast. Density maps were created by running 106 numerical simulations of the kobs for each scheme presented, as described elsewhere (23). Four different mechanisms of binding are compared: (A) general conformational selection, (B) general induced fit, (C) sequential conformational selection and induced fit, and (D) extended linkage scheme. The results from thirteen experimental systems discussed in the text are superimposed above the density maps for comparison. Symbols are as follows: IgE (green squares), IgG (green circle), protein kinase A (black circles), DnaC (yellow circle), CheA (yellow triangle), histone deacetylase-like amidohydrolase (blue square), polymerase X (yellow square), 3-hydroxybenzoate 6-hydroxylase (green triangle), 3-chloroacrylic acid dehalogenase (black square), proline utilization A protein (blue circle), ACTR and CREB-binding protein (black diamond), K+-mediated G-quadruplex folding (black triangles), and DnaB (blue triangles). The extended linkage scheme gives the best fit of the experimental data, followed by the general conformational selection model.

