Figure 7.

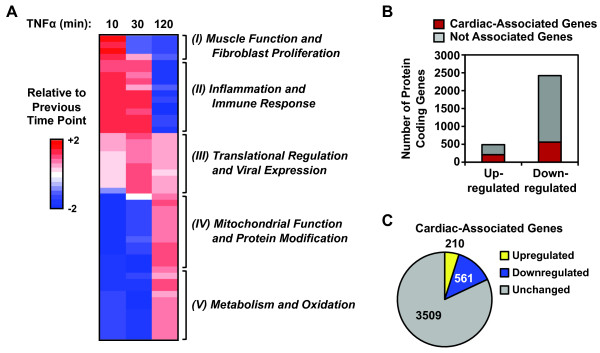
The TNFα-induced transcriptional response in AC16 cells reveals a functional link between inflammation and cardiomyocyte biology. A) The heatmap represents time-dependent changes in the enrichment of Gene Ontology (GO) terms in response to TNFα treatment. In this representation, the x-axis (columns) is time of TNFα treatment and the y-axis (rows) is the GO terms, with those that are enriched shown in red and those that are de-enriched shown in blue. The GO terms represent the properties of gene sets clustered based on related molecular functions and biological processes. We used Gene Set Enrichment Analysis (GSEA) to identify the top 25 enriched GO terms based on the TNFα significantly upregulated gene set and the top 25 de-enriched GO terms based on the TNFα significantly downregulated gene set. We then calculated the normalized enrichment score for each of the 50 GO terms at the indicated time points and clustered them based on the time-dependent changes using hierarchical clustering. Each line across represents the relative enrichment score of an enriched (in red) or de-enriched (in blue) GO term relative to the previous time point. The GO terms in each cluster are listed in Additional file 6. The number of GO terms in each cluster is: (I) 5, (II) 11, (III) 10, (IV) 12, and (V) 12. B) Many TNFα-regulated genes have cardiac-associated functions, as assigned by the Cardiovascular Gene Ontology Annotation Initiative. The bar graph shows the number of protein coding genes from the AC16 cell TNFα-regulated gene set that have or do not have cardiac-associated functions. C) Many of the 4,278 cardiac-associated genes identified by the Cardiovascular Gene Ontology Annotation Initiative project are regulated by TNFα. Pie chart showing the number of genes from the 4,278 cardiac-associated genes that are up-, down-, or unregulated by TNFα.
