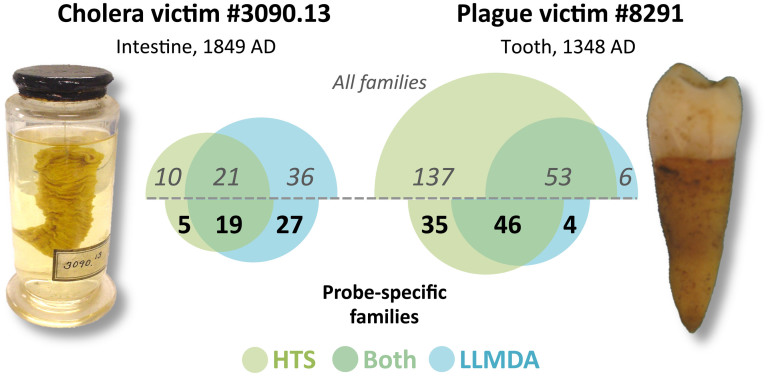
Figure 1. Number of bacterial families detected by HTS and/or LLMDA.
Number of bacterial families (or less-specific higher taxonomic level) detected by HTS sequencing (green circles) and LLMDA analyses (blue circles). Families detected by both methods are indicated where the circles overlap. Values above the midline include all detected families, whereas values below the midline include only those families used for LLMDA probe design. Image of cholera victim specimen 3090.13 was taken by AMD; image of plague victim specimen 8291 was taken by HNP.

