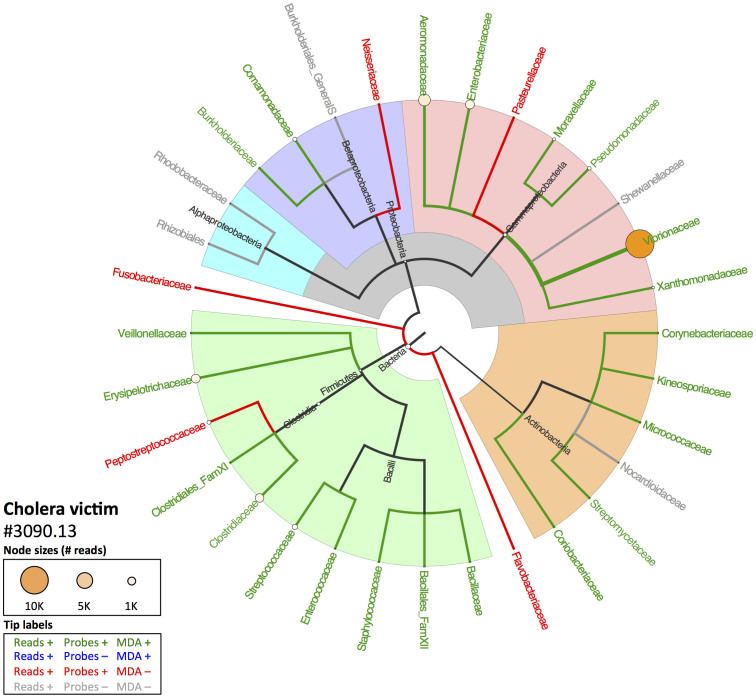
Figure 2. Comparison of HTS and LLMDA results for cholera victim 3090.13.
Cladogram based on NCBI Genbank taxonomy indicating results of the BLASTN/MEGAN4 HTS analysis at the family level and above compared to LLMDA results. At the leaves, circle size reflects the relative number of reads assigned to those taxa (internal node sizes only indicated if >10 reads). Colors of taxon names indicate whether that taxon had (1) reads present in the HTS data, (2) probes designed for that family on the LLMDA, and (3) LLMDA call for that taxon. Bacterial phyla and major clades are highlighted.

