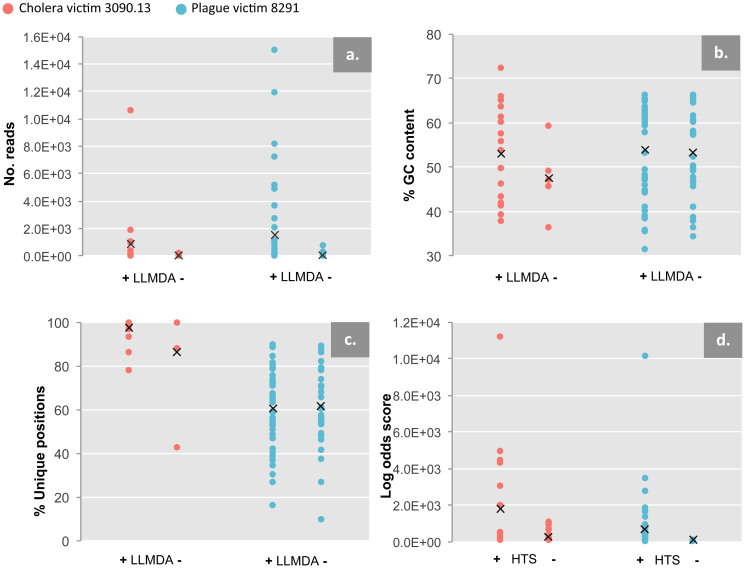
Figure 4. HTS vs. LLMDA comparisons.
HTS readcounts, GC content, unique genomic positions sequenced, and maximum log odds scores for both specimens plotted against whether they were detected (+) or not detected (-) with LLMDA (a–c) or HTS (d). For HTS read counts, all HTS-identified families are analyzed (a); GC content and unique genomic positions are analyzed only for families that were used for LLMDA probe design (b,c); log odds scores are only analyzed for families detected with LLMDA.

