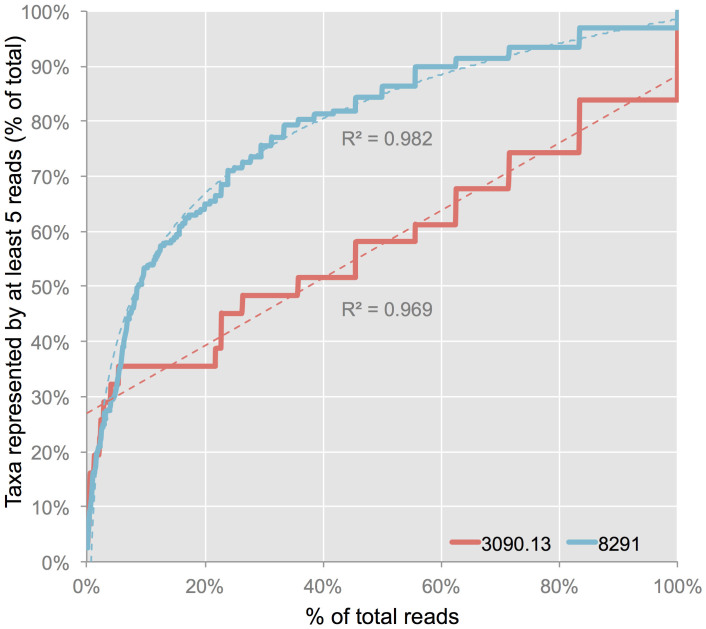
Figure 5. HTS rarefaction analysis.
Rarefaction curves showing the number of bacterial families represented by at least 5 reads as a percent of the total observed families per sample with increasing read depth (0.1% increments). Dashed lines represent lines of best-fit; cholera victim specimen 3090.13 is a linear curve (R2 = 0.96936), plague victim specimen 8291 is a logarithmic curve (R2 = 0.98217).

