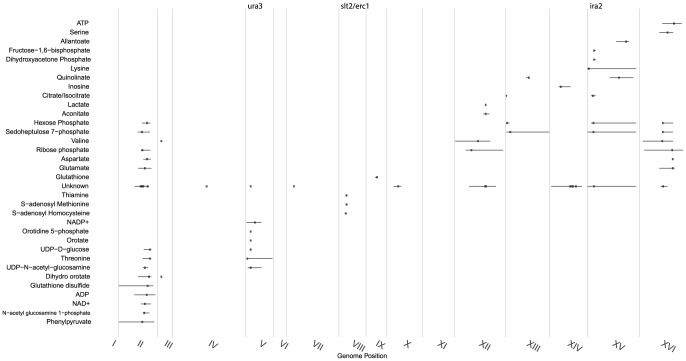
Figure 1. Distribution of significant linkages across the genome.
Metabolite linkages that exceeded the 0.1 FDR significance threshold are plotted based on their most significant marker's genome location (indicated with a dot) with a 95% confidence interval. Continuous vertical lines represent chromosome ends. Numerals are placed at chromosomes' center. Genes investigated in this study are shown at top. mQTLs for ions of unknown identity were combined into a single class.

