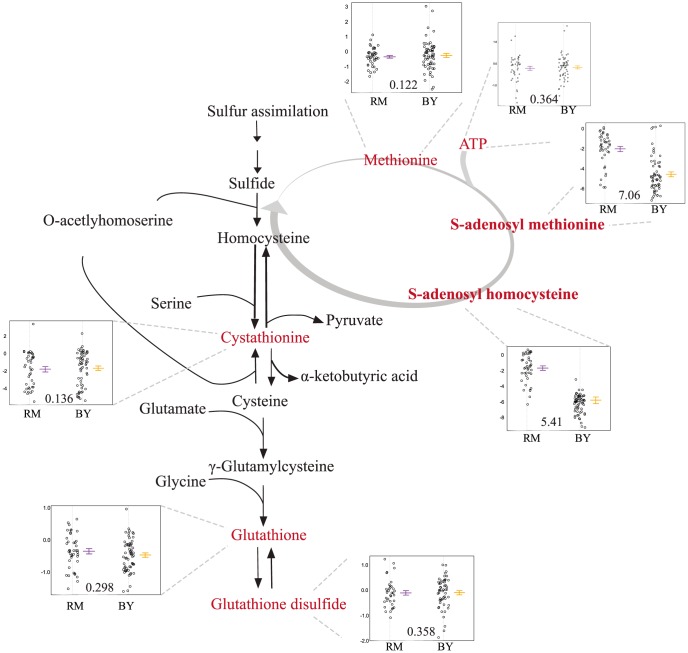
Figure 4. Levels of sulfur-assimilation intermediates differ based on the slt2 allele inherited.
The relevant portions of the pathway are shown, with measured metabolites in red. The accompanying plots display the phenotypic distribution of the segregants based only on the allele of slt2 inherited: RM in purple, BY in orange. All metabolite levels are log2(Segregant/RM). Compounds that were significantly linked to slt2/Erc1 locus (via LOD scores) are shown in bold.

