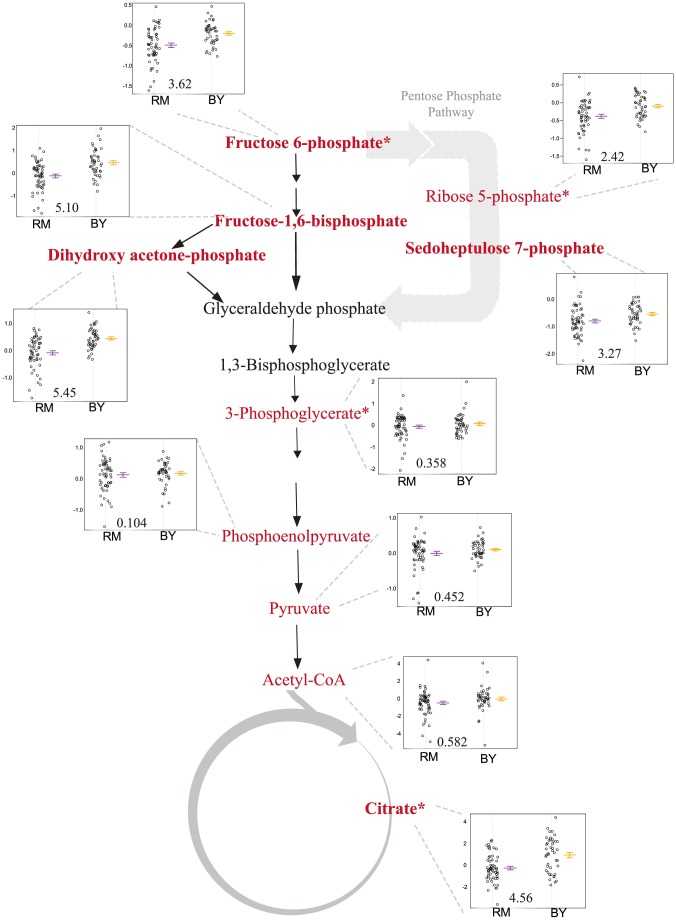
Figure 6. Levels of glycolysis, pentose phosphate pathway and TCA intermediates differ based on the ira2 allele inherited.
The relevant portions of the pathway are shown, with measured metabolites in red and significant linkages shown in bold. The accompanying plots show phenotype distribution of the segregants based only on the allele of IRA2 inherited: RM in purple, BY in orange. All metabolite levels are log2(Segregant/RM). LOD score for the closest marker is also shown. *includes analytically indistinguishable isomers.

