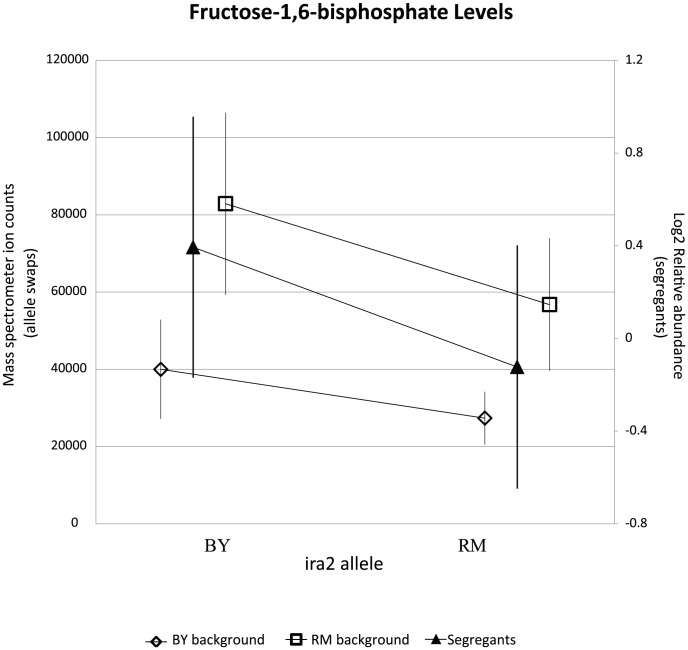
Figure 7. RM-inheriting segregants for ira2 show significantly lower levels for fructose-1,6-bisphosphate.
Intensities (mean  standard error) of FBP are plotted based upon the allele of ira2. Mass spectrometer ion counts for BY background (diamonds) and RM background (squares) are shown on the left axis while segregants' log2 relative abundances (triangles) are indicated on the right axis.

