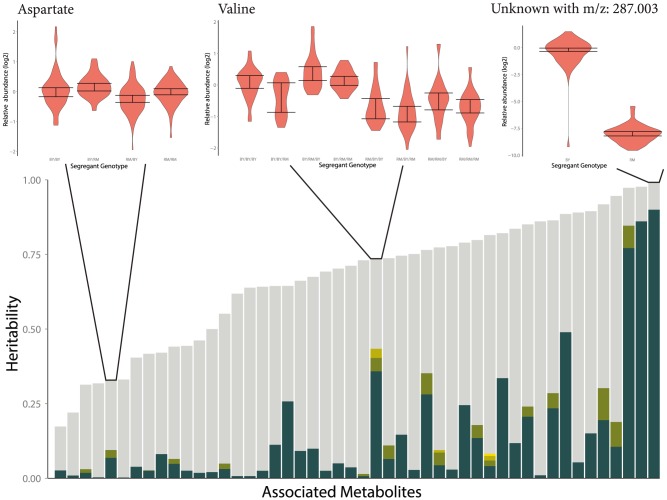
Figure 9. Fraction of broad-sense heritability explained by identified mQTLs.
Each stacked bar represents a single metabolite which was significantly associated with at least one locus. The height of the bar is the broad-sense heritability of the metabolite's abundance, and the coloration partitions this heritability into unexplained heritability (gray), and the effects of each mapped QTL (colors). Three examples are given to demonstrate the variable effect sizes observed across metabolites. The distribution of metabolite abundances for a genotype is shown as a violin plot, and a 95% confidence interval for the median of each genotype is reported with error bars. This confidence interval was determined using a percentile bootstrapping method [73].

