
Figure 4.
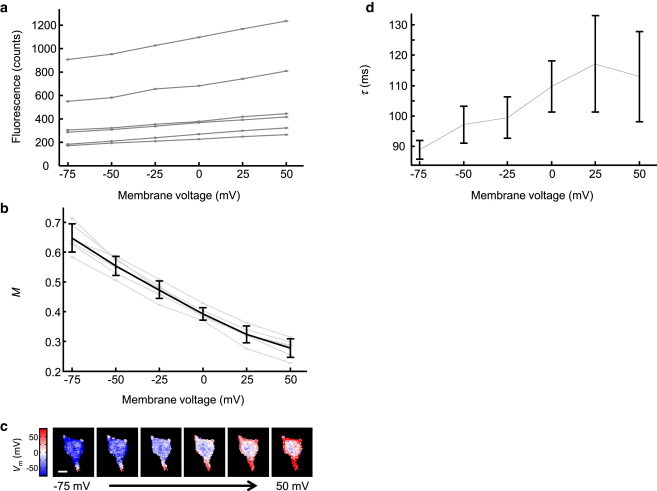
Time-domain response of Arch(D95H) gives a robust measure of absolute voltage. (a) Steady-state fluorescence of Arch(D95H) in six cells as a function of membrane voltage. Due to wide variations in protein expression levels, absolute fluorescence was not a robust measure of absolute voltage. (b) Time-domain response of Arch(D95H) under the illumination parameters of Fig. 3c. The fractional amplitude of the fluorescence relaxation, M, reported voltage with an absolute accuracy of σV = 9.8 mV. Gray lines show M(Vm) for the same six cells plotted in (a). (c) Map of voltage in a spinning disk confocal image of a single cell. Colormap indicates distribution of Vm at six values of the applied voltage, as calculated from calibration in (b). The voltage-dependent pixels are predominantly localized to the periphery of the cell, as one would anticipate for a voltage sensor. Values in the interior of the cell are determined by a combination of fluorescence from internalized Arch(D95H) (not sensitive to membrane voltage) and out-of-focus Arch(D95H) localized to the dorsal and ventral plasma membranes. Scale bar represents 10 μm. (d) Voltage-dependent time constant of fluorescence relaxation in Arch(D95H). The time constant, τ, was sensitive to membrane voltage, but not sufficiently so to serve as a reliable measure of absolute voltage. To see this figure in color, go online.