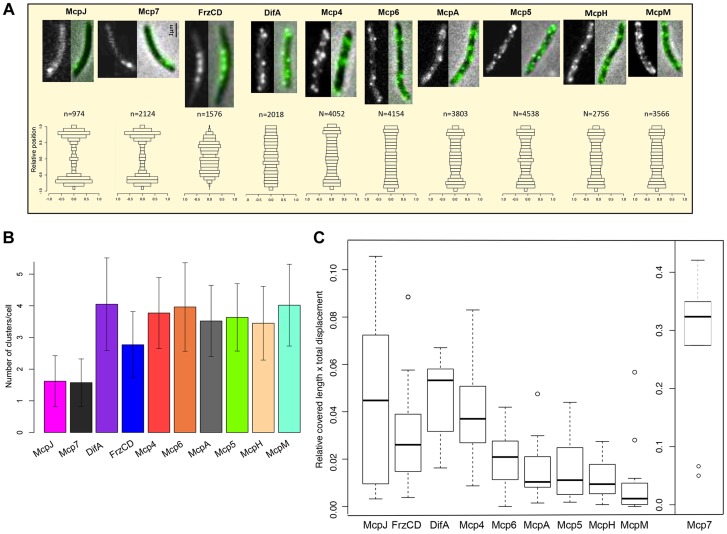
Figure 4. MCP-GFP fusions localize in multiple dynamic clusters in cells.
(A) In the first row, fluorescence (left) and overlay between fluorescence and phase contrast images (right) are shown for each MCP-GFP. In the bottom row, n clusters (numbers indicated above the histograms) were analyzed for each mcp-gfp strain and their relative position in cells in the y-axis is shown (0.0 indicate the center of the cell along the y-axis). Bars indicate the fraction of clusters localizing in the corresponding position in the y-axis. (B) Average number of clusters for each MCP-GFP. (C) Box plots indicate the medians of the product of the relative cell length and the total distance covered by the MCP-GFP clusters * = p<0.05; ** = p<0. 5E-04 (refer also to Methods, Table S2 and Figure S4).

