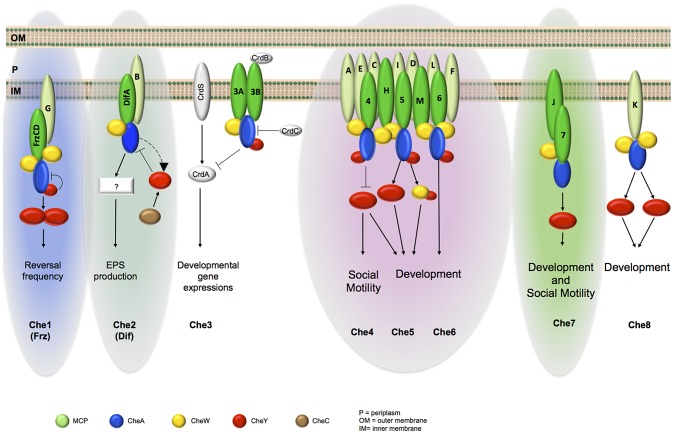
Figure 8. Schematic organization of M. xanthus Che modules as depicted from phylogenetic, cell biology and protein interaction analyses.
For clarity, we omitted CheR and CheB proteins and do not specify the MCP-CheW interactions. MCPs in light green are the ones for which interactions with a CSS have not been demonstrated. The different color backgrounds indicate taxonomic Group 1 (green), Group 2 (blue) and Group 3 (pink). Group 1 was further divided in two subgroups labelled with light and dark green, based on the localization analysis.

