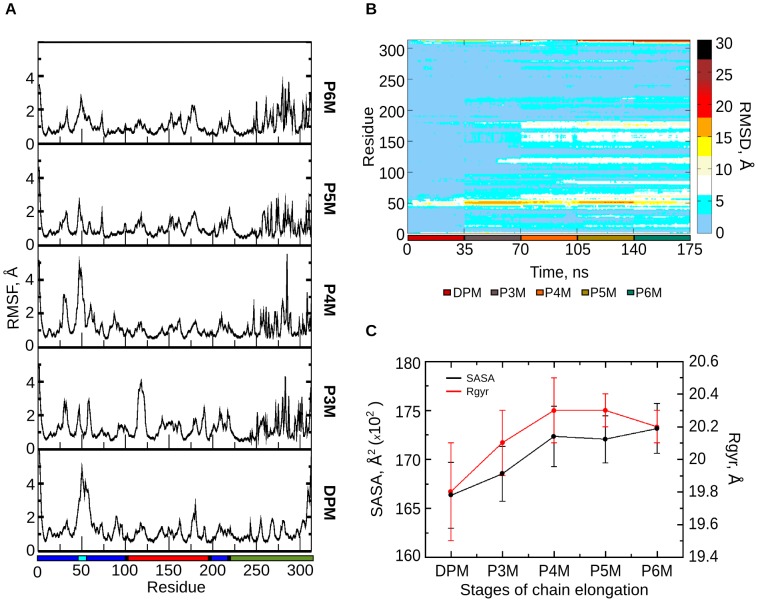
Figure 4. Protein dynamics during pyrrole chain elongation.
A. RMSF plot of the protein from DPM to P6M stages. The color bar at the bottom corresponds to the domain demarcation (domain 1 – blue, domain 2 – red and domain 3 – green, active site loop – cyan, hinge regions – black). B. HeatMap showing the residue-wise contribution to RMSD of the protein through the different stages of simulation indicated by a color bar at the right. The simulation stages are denoted by a color bar along the abscissa. C. Solvent Accessible Surface Area (SASA) and Radius of gyration (Rgyr) values show the loss of compactness of the protein on addition of each PBG molecule through the stages of simulation from DPM to P6M. The error bars shown in the figure represent the standard deviation of the data from the mean.

