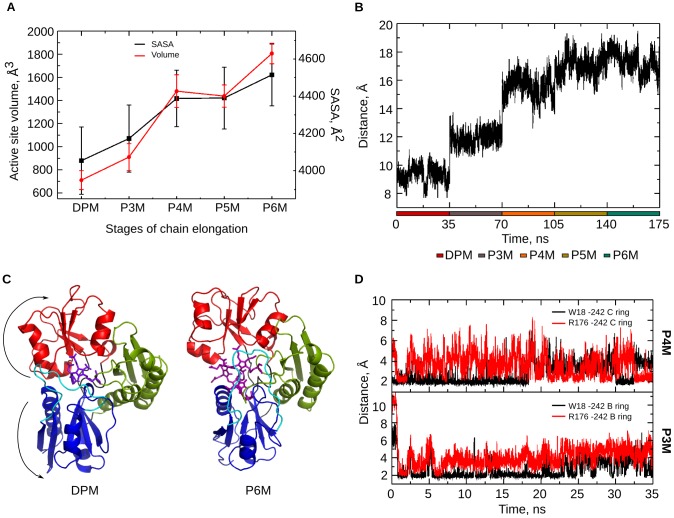
Figure 8. Polypyrrole chain accommodation.
A. Volume of the active site and cumulative SASA of the active site residues (as reported in Table 1) show an increase from DPM to P6M stage with the addition of each PBG molecule. B. Graph showing the increase in domain separation between domain 1 and 2 during the catalytic stages of PBGD. C. Polypyrrole accommodation within the active site cleft as a result of major domain movements during chain elongation; snapshots of only DPM & P6M stages are shown. D. Graphs of the interaction between W18 and R176 with B ring of pyrrole chain in P3M stage and with C ring of pyrrole chain in P4M stage showing the shift in interactions to accommodate the polypyrrole chain.

