
Figure 13. Comparison of average structures of DPM and no-HMB stages.
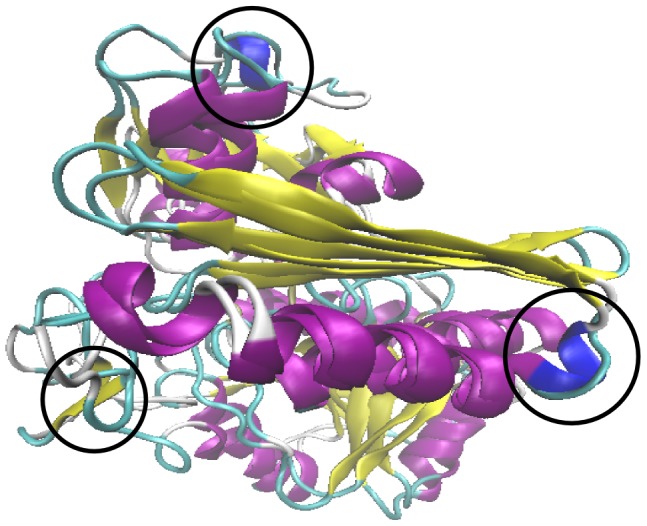
Superposed average structures of the DPM and no-HMB stages. The encircled regions show secondary structures that are yet to be regained after the protein relaxation for 150 ns.
Official websites use .gov
A
.gov website belongs to an official
government organization in the United States.
Secure .gov websites use HTTPS
A lock (
) or https:// means you've safely
connected to the .gov website. Share sensitive
information only on official, secure websites.
Superposed average structures of the DPM and no-HMB stages. The encircled regions show secondary structures that are yet to be regained after the protein relaxation for 150 ns.