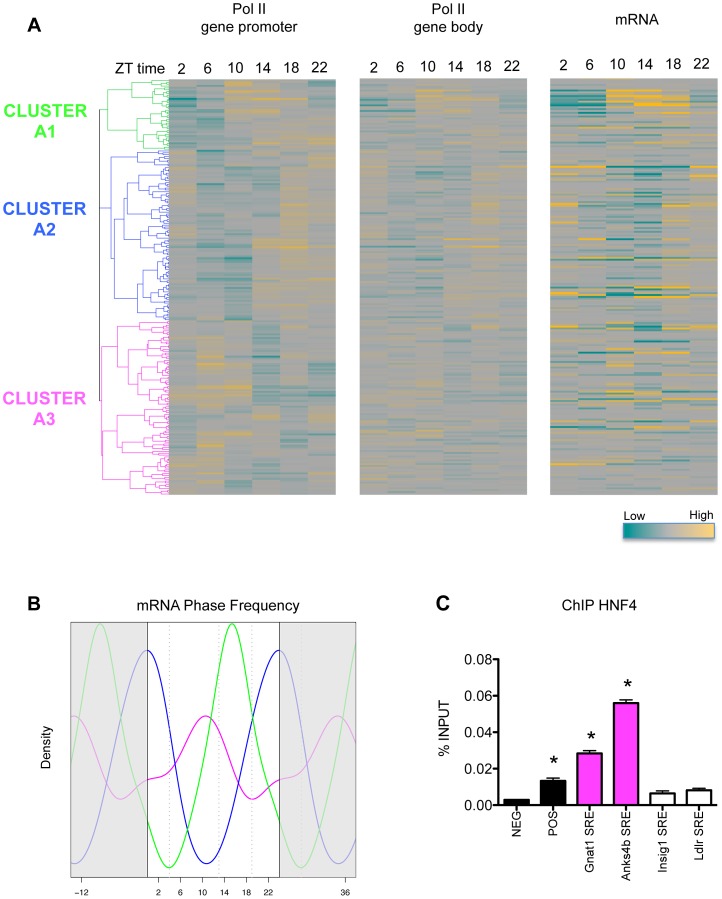
Figure 3. Pol II recruitment on SREBP1 target genes is not always synchronized with SREBP1 binding.
(A) The heat-maps represent the recruitment of Pol II to the promoter (left) and to the gene body (middle) of SREBP1 putative target genes along the day, as assessed in our previous ChIP-seq data set [24]. In parallel, we evaluated hepatic gene expression by microarray analysis in the same samples (right). Hierarchical clustering was done applying a Pearson correlation scores to the data describing Pol II recruitment on the promoters of SREBP1 target genes (left). Three major clusters of genes displaying a different temporal binding profile of Pol II were identified (A1, A2, and A3). The genes are ordered in the three heat-maps according to this clustering. (B) Gene expression data from microarray analysis were fit to a cosine function to estimate the phase of expression (peak time of the fit) of SREBP1 target genes. The graph shows the smoothing of phase distributions of the genes belonging to the three clusters (green line for A1, blue line for A2, magenta line for A3). Only genes with a P-value<0.05 are plotted. Dotted lines define three time intervals containing the most recurrent phases associated to the genes belonging to the clusters A1, A2 and A3. (C) HNF4 binding was tested on randomly selected SRE identified in our SREBP1 ChIP-seq. Gnat1 and Anks4b SREs belong to cluster A3 and contain a HNF4 putative binding sites. In contrast, Ldlr and Insig1 SREs do not contain in their sequence a HNF4 motif and belong to cluster A2. NEG and POS were used as negative and positive control loci and correspond to two regions of Cyp7a1 promoter, localized at −1500 and −150 from the TSS, respectively [69]. The graph shows the mean ± SEM of three independent experiments. * indicates P-value<0.01 vs. NEG. Statistical analysis was performed by one-way ANOVA followed by Bonferroni post-test. Primer sequences are listed in Table S8.

