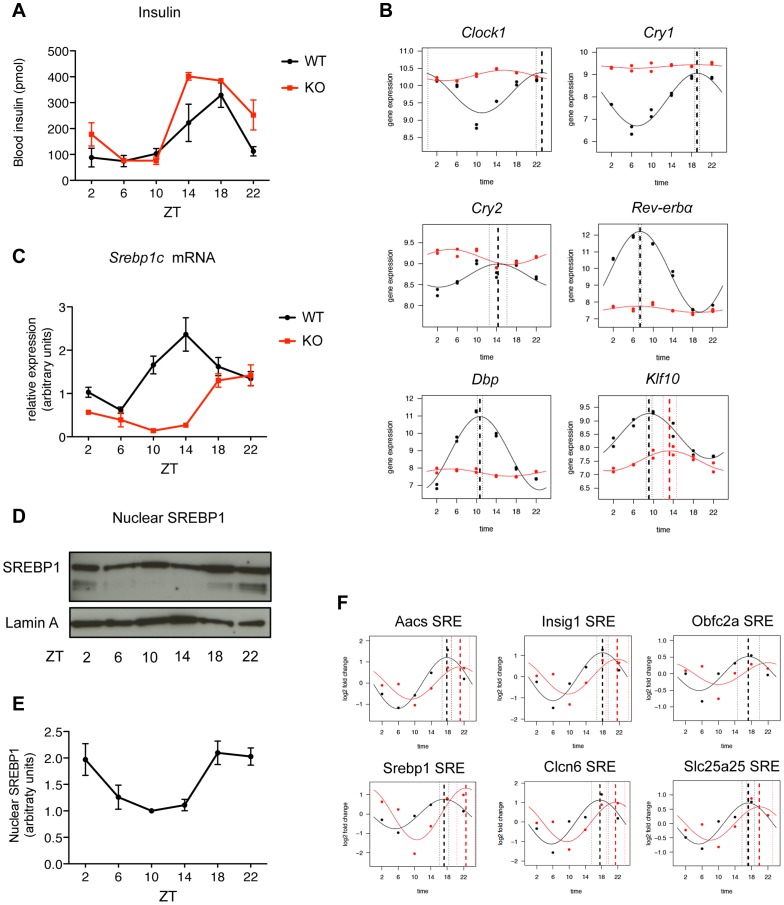
Figure 4. SREBP1 binding is rhythmic in Bmal1−/− upon time-restricted feeding.
(A) Bmal1−/− (red line) and control mice (black line) were fed only during the night for one week before the sacrifice. Plasma insulin levels were measured at the indicated time points (n = 3–6). (B) mRNA levels of key genes of the cellular molecular clock were measured by qPCR in Bmal1−/− and control mice (n = 5). (C) Hepatic expression of Srebp1c was evaluated by qPCR in Bmal1−/− and control mice (n = 5). Data are normalized using 36b4 and Rps9 as housekeeping genes. (D) Representative western blot analysis of the nuclear SREBP1 in hepatic nuclear extracts from Bmal1−/− mice. Lamin A was used as loading control. Each sample is a pool of 5 livers. (E) Western Blot quantification was performed by densitometry, using ImageJ software. Each point represents the mean ± SEM of the quantification of three analyses performed in three independent sets of Bmal1−/− mice (n≥3 per each time point). (F) ChIP of SREBP1 was performed in livers of Bmal1−/− and control mice at the indicated time points. SREBP1 binding was tested on 6 loci (SRE) identified by ChIP-seq in the proximity of the indicated genes. Aacs and Srebp1c belong to cluster A1, Insig1 and Clcn6 belong to cluster A2, whereas Obfc2a and Slc25a25 belong to cluster A3. Primer sequences used for qPCR analyses are available in Tables S7 and S8.

