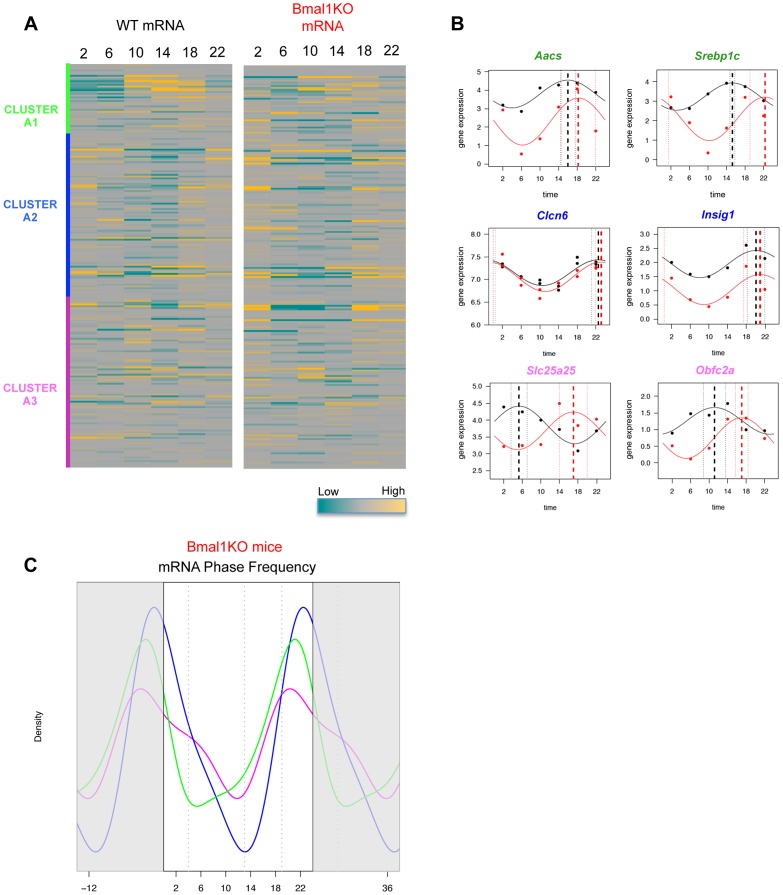
Figure 5. Phase of expression of rhythmic SREBP1 target genes is perturbed in Bmal1−/− upon time-restricted feeding.
(A) The heat-maps represent the hepatic gene expression of putative SREBP1 target genes in wild type (left) and Bmal1−/− mice (right), after one week of time-restricted feeding, as assessed by microarray analysis. The order of the genes is based on the clustering shown in figure 3 and is maintained in the two heat-maps. (B) Validation of hepatic mRNA level variation of a panel of the indicated SREBP1 putative target genes. (C) Gene expression data from microarray analysis in Bmal1−/− mice were fit to a cosine function to estimate the phase of expression (peak time of the fit) of SREBP1 target genes. The graph shows the smoothing of phase distributions of the genes belonging to the three clusters (green line for A1, blue line for A2, magenta line for A3). Only genes showing a P value<0.05 in Bmal1−/− mice are plotted.

